
Two of the most interesting charts to watch at the moment are the charts for the Dow and TRAN indices. I posted my divergence chart on Friday morning with the short term wedges marked in, and posted the separate close-up short term charts on twitter. The Dow rising wedge is showing definite signs of breaking down and that's something to watch today. Here's the combined bigger picture chart again:

ES showed quite a bit of weakness overnight and the possible double-top indicating to the 1336 area is still most definitely in play. Shorter term ES has bounced at the eight day support trendline having reached oversold on the RSIs for every timeframe from an hour downwards. If we are to see that double-top play out the first signal will be a break of that trendline in the 1360.50 area and then a break of the pattern neckline at 1356.75. I'd still like to see a move below 1352 SPX to confirm that a significant retracement has started:

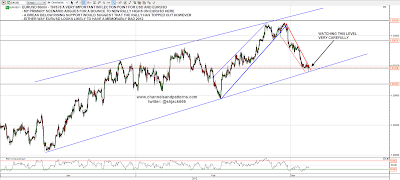
EURUSD is at a major inflection point here, with a possibility that we have seen a rally high. I posted the USD chart showing the declining resistance test on Saturday and you can see that here. I'll be watching the EURUSD chart carefully here to see whether my primary scenario that EURUSD will go higher still looks solid, and so far at least support is holding:
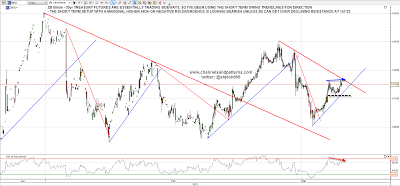
30yr Treasury futures have essentially been trading sideways for months and I've been using the short term support and resistance trendlines to judge immediate direction. The immediate direction looks to be down this morning with a little double-top in place and short term rising support having broken since I capped the chart. The immediate pattern target is in the 140'18 area but obvious support is in the 139'15 to 140 area:
Oil broke short term rising support overnight and some technical damage has been done to the uptrend in the short term. There is strong support in the 105-6 area but on a break below 105 I'd be looking for a test of main rising support in the 100.50 area, supported by the short term double-top indicating to that area:

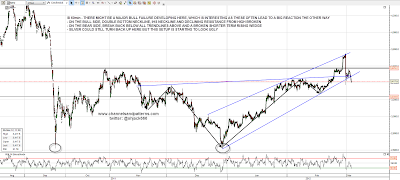
Silver is looking very interesting here. The bullish setup last week was formidable, with silver breaking up through double-bottom and IHS necklines and declining resistance from the high. This strong bull setup makes this reversal look ominous as a failure of a setup like this often delivers a strong reaction. The failure of the rising wedge and the support trendline from the low support at least some more downside short term:
One of the odder economic things that we read about nowadays is the truly staggering amount of total derivatives outstanding. A figure from the Bank of International Settlements (BIS) has the total figure at June 2011 at a staggering $707tn, up from £594tn in June 2009. To put that figure in perspective the GDP in the US in 2010 was $14.6tn, and a rough figure for total world GDP in 2010 would seem to be in the $55tn to $60tn area. On that basis total derivatives exposure would be some twelve times larger than the entire world economy.
I've read comments that the net exposure figure is actually fairly low as when you net out the short and long contracts then the netted out risk is small, but in terms of Credit Default Swaps (CDS) that begs an obvious question. CDS are insurance written against bonds that pay out in the event of default. Every CDS is effectively a short position on bonds that is no doubt balanced out in many cases against a long position in those bonds. That would balance out to a significant degree for the bondholders, but it seems most unlikely that it would balance out for the insurance underwriters, where much of that exposure would be likely to be naked, and total CDS outstanding at June 2011 were at 32.4tn, many times higher than any possible provisions made against this exposure.
AIG failed in 2009 because it had written huge amounts of insurance against mortgage bonds without setting aside significant capital to cover potential losses. Regulators were clearly asleep at the wheel while that was happening, but it is really possible that they have ignored a directly equivalent and much larger problem on CDS? It might be, and if so that would explain why the global CDS market is being vigorously attacked at the moment. The shameful decision by ISDA last week that the current restructuring of Greek sovereign debt did not constitute a default event strike at the heart of the CDS market, but if the foundations of that market are essentially fraudulent, then a series of moves designed to close it down in the next few years would obviously be sensible.
The BIS chart is below and is an interesting read. There are is an interesting post by Bruce Krasting on the ISDA decision here, and a slightly paranoid post on the subject by the Market Oracle here. I'm not much for conspiracy theories myself, as combinations of incompetence, ignorance and and greed seem to deliver the goods more reliably, but the current situation on derivatives does at the least seem rather strange:

Short term I'm seeing a reversal up on EURUSD and a reversal down on bonds, so the current bounce on ES might have some legs. I have short term declining resistance on ES in the 1368.25 area and I'll be watching to see whether the bounce can get over that. In the event that we see a new high today I have main SPX resistance in the 1382-4 area.
