
1340 SPX broke with some confidence yesterday and is no longer strong support. The double-top and H&S targets on SPX are in the 1292 area at the October high and that is the next big support level on SPX. Those are both high probability patterns and looking at a wide spectrum of charts this morning the odds that we will see that test in the next few days or weeks looks good. Everything looks oversold and we may well see some decent bounces on the way however. These bounces will look like good short entry points. Here's the SPX 60min chart:
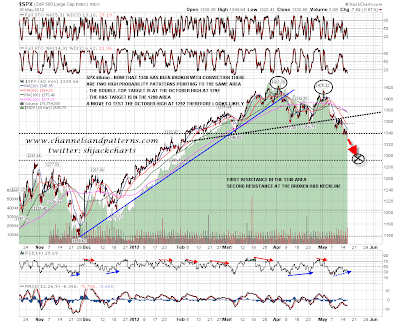
On the SPX 15min chart I have a declining channel with one failed breakout. Channel resistance is in the 1340 area this morning and on a break over that the key overhead resistance levels are in the 1348 and 1365-6 areas:

Obviously you don't always get a bounce while an H&S is playing out. After the retest of the H&S neckline there was no bounce of significance on EURUSD before it reached the pattern target in the 1.27 area overnight. At the same time the potential channel support I have on EURUSD was hit so if we are gong to see a bounce, then this is the place. I have declining resistance and strong level resistance in the 1.281 area today so if we do see a bounce that would be the obvious target. It would be a substantial understatement to say that I am expecting more downside longer term on EURUSD however, and a move back to declining channel resistance in the 1.32 area seems unlikely:

I've been considering the setup on GBPUSD, as it broke rising support from January yesterday. There's an interesting setup there as there appeared to be a complete H&S formed there in January, and the rally from the neckline went over the right shoulder. Interestingly though, that rally topped out exactly at the same level as the left shoulder, so I'm redrawing this as a part-formed H&S with the right shoulder top at the last high. The neckline is in the 1.52 area and on a break below the pattern target would be in the 1.38 area, in the middle of the multi-decade 1.36-1.40 support zone. If my IHS on USD plays out that target would be realistic:

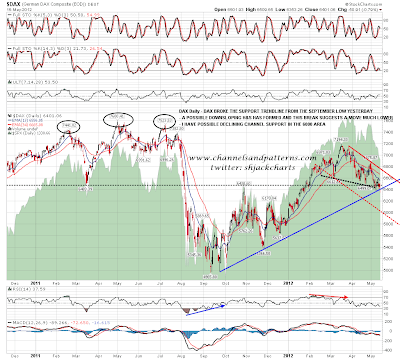
Dax broke below rising support from October yesterday and I'm expecting more downside. Worth noting that it closed back at the trendline though and a more definite break is required to open up lower targets:
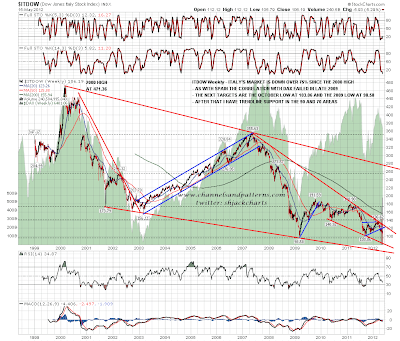
I thought I'd post the Italian stock market chart today to show how grim that looks here. It is down over 75% from the 2000 high and there's little reason to think that there won't be more downside. I've marked the support levels on the chart:
Well, that's plenty of bear eye candy today. Is there anything for the bulls? Yes. I don't know whether it will deliver, as bullish reversal setups have been living short and tragic lives recently, but after the failure of the last falling wedge a larger one has developed and just broke up. The target is the 1363 area, and there's strong resistance in the 1347 area. I don't have a lot of confidence that this will make target but it might. Here's the setup on the ES 15min chart:

Overall the trend is down but there's a promising setup for a bounce here. Everything looks very oversold pretty much so a relief rally of whatever size looks likely soon. I've overrun on chart numbers today so I'll be doing a big picture gold and silver post separately later today.
