
Two important things happened on SPX on Friday. The first was that SPX broke up and touched the upper bollinger band on the daily chart. This is the first likely point of failure over the middle bollinger band on the daily chart if this move has just been an oversold rally. The obvious cause for failure would be the election in Greece, though the result there looks like a victory for pro-bailout deal parties at the moment:
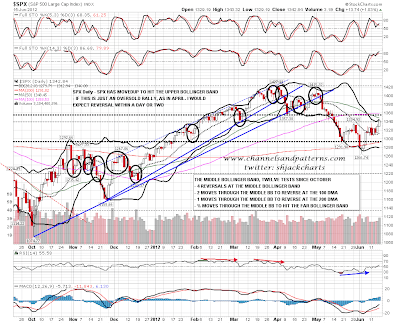
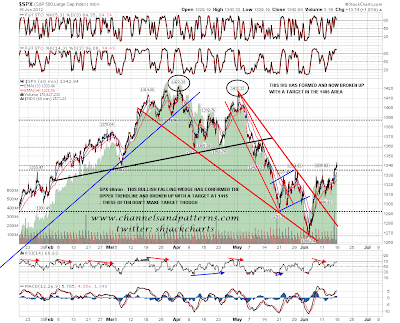
If it doesn't fail very early this week however, the second important thing that happened on Friday looks very bullish, and that is that an inverted head and shoulder pattern (IHS) formed at the low, and broke up through the neckline on Friday. That is a high probability pattern with a target in the 1405 area, and is supported by the bullish falling wedge that broke up the previous week, though that is a less high probability pattern for making the wedge target at 1415:
This is the sixth reversal IHS to form on SPX since the start of 2009, after a move down of more than fifty points. All of the other five made the pattern target, which is an impressive track record. They were as follows:
- Jan-April 2009 – Made Target
- Jan/Feb 2010 – Made Target
- May-Sep 2010 – Made Target
- June 2011 – Made Target
- Nov 2011 – Made Target
- Feb/Apr 2011 – Cont IHS Failed
- Nov/Dec 2011 – Cont IHS Made Target
The thing to take away from this is that these IHS reversal patterns have a very impressive track record on SPX and that a move back to at least test 1400 now looks much likely as a result. Unless we see a strong and immediate breakdown this week in the wake of the greek election, that's what I'll be looking for within a few weeks.
This is obviously a strongly bullish setup on SPX, so what support does this have on the other US equity indices? The strongest support in on Dow, where the April/May double-top played out to target, an upsloping IHS formed and has broken up, also breaking back above broken double-top neckline support. The pattern target is the 13,250 area, but it's worth mentioning that the move from the low is currently within a bearish rising wedge with a strong resistance trendline. This will be a stronger bullish setup when that resistance trendline has broken:

On NDX the February to May H&S made target, and another upsloping IHS has formed from the low. That needs a conviction break over 2585 to trigger the IHS target in the 2710 area:

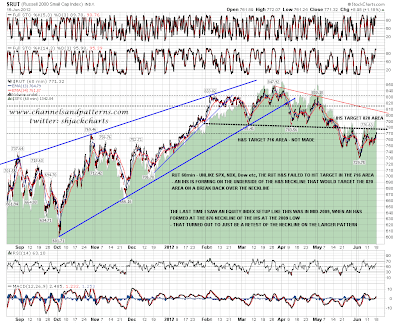
RUT has the weakest looking setup at the moment though there is also a bullish looking IHS there. However the February to May H&S pattern there never made the pattern target at 716, and what we're currently seeing might therefore be interpreted as a neckline retest, though I wouldn't normally expect to see one of those after the H&S had played out more than halfway towards the target. If we see a break over the downsloping neckline in the 775 area however that will trigger an IHS target in the 820 area. I'll be more confident about that making target once RUT closes a day over the 775 neckline though:
I have a previous example of an H&S setup that looks like RUT does at the moment and that's from 2009. I've seen several different interpretations of the reversal setup in 2009 but I think, modesty apart, mine fits best. The reversal IHS formed at 875 as the neckline and then a smaller (upsloping) H&S formed above that neckline, which was retested in May and July 2009. The key support area was obviously the neckline at 875 and that was never broken on a closing basis. This example suggests some caution until we see a daily close on RUT over the neckline at 775. I've added in a daily moving averages analysis on the chart for anyone interested:

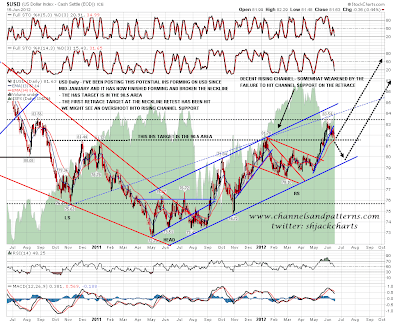
Am I convinced by this bullish setup on SPX here? Not entirely. If we see failure I'd expect it quickly, probably today, and I would be watching the 1325 SPX /1320 ES level for support. A break below would look bearish, and a daily close below even more so. Supporting failure here is the USD chart, where the much larger IHS neckline was tested on Friday. That is the most obvious level for USD to reverse back up, and a close back below the neckline would weaken this pattern, though it wouldn't invalidate it. I have added an option on the chart in the event that USD does break below the neckline, and that would target rising channel support in the 79.5 area:
I will be leaning bullish on balance unless we see a move back below 1325 SPX / 1320 ES. None of the five successful reversal IHSes that I have listed above saw a neckline retest that went more than ten points below the neckline and if we see that today it will be a significant warning signal, though it wouldn't invalidate the IHS. Next support is the daily middle bollinger band (20 DMA) in the 1315 area. A close much below the daily middle bollinger band or a further break below the right shoulder low at 1306.52 would kill this IHS on SPX in my view.
