
There's quite a bit of positive divergence this morning and on NDX / NQ, this is a very significant level with a strong reversal setup. I posted the chart below on twitter last night showing NQ having made the H&S target yesterday, stalled there at strong support, and the W bottom setup if NQ can manage to get back over 2695. This really is a strong reversal setup and it's worth watching carefully to see what happens here:

On SPX there was a close well below the lower bollinger band yesterday and this is often seen at or near a significant low. If we see a strong reversal today (closing basis) I'd expect to see a run back up to the middle bollinger band at least in the 1440 area. You can see looking at last November though that SPX sometimes runs further down riding the lower bollinger band so we would need to see a close significantly above to confirm any reversal.
Meanwhile this strong downtrend needs to be respected and it's also worth noting from the chart that RSI has dropped below the 45-55 band that is generally support for retracements during uptrends, and that the obvious targets below are at the 1397 SPX possible neckline I've been mentioning, close to the 100 DMA at 1393, and at rising support from the October low, close to the 200 DMA in the 1375 area:
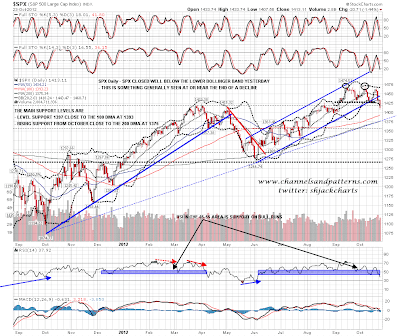
On the SPX 60min chart support in the 1425 area has now been decisively lost and the next strong support level is in the 1397 area:

The ES 60min, like NQ, is showing strong positive divergence and I have a possible falling wedge there. Wedge resistance is currently in the 1415 area and the overnight action looks like a bear flag. There is some support at 1400 but the next big support level (and possible H&S neckline) is in the 1388 area:

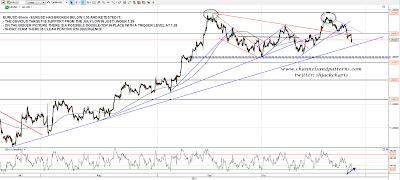
On EURUSD the 1.30 level was lost and retested yesterday and the obvious target is rising support from the June low in the 1.289 area. There is strong positive divergence at the last low and we might see another test of 1.30 on the strength of it. On the bigger picture there is obviously a possible double-top in place that would trigger a target near strong 1.244 area support on a break below 1.28:
CL lost the important 88 level yesterday and there's now not much support below before a test of very strong support around 79. You may be wondering why I have not been mentioning the large H&S pattern with the neckline at 88, and that's because the rise into it is too short to make a viable pattern in my view. Nonetheless the break below 88 looks very bearish:

I'll be watching NQ closely here for direction. I think AAPL has further downside ahead and if so then strong 2650 area support may well break, but until it does that is a strongly bullish setup on NQ. In a strong trend however, reversal setups tend to get bulldozed, and this is now looking increasingly like a strong trend. The obvious targets on ES, SPX, EURUSD and oil are still some way below.
