
I was saying yesterday morning that equities were looking short term toppy and they broke down fairly early in the day. On the SPX daily chart the decline found support at 1416, just over the support levels at the 50 and 100 DMAs that I mentioned in the morning. That could be the extent of the retracement, though I'm thinking we most likely see more, and on a break below 1415 area support I'll be looking at the daily middle bollinger band or 20 DMA in the 1405 area:

On the SPX 60min chart the support trendline from the November low was confirmed and then broken yesterday. The move from the November low has formed a rising wedge type pattern, though there aren't enough crosses to make it a decent rising wedge. Nonetheless I would normally expect more downside after a break like this and the important levels on this chart are in the 1400 and 1385-90 areas:

On NDX the bull and bear patterns there are both still very much in play. On the bull side a conviction break over 2700 would trigger an IHS target in the 2900 area. On the bear side a break below 2623 would trigger a double-top target in the 2550 area. NDX was much weaker than SPX yesterday and that is a concern for the bull case, as a move below 2623 would also weaken this IHS setup to the extent that I would then disregard it:

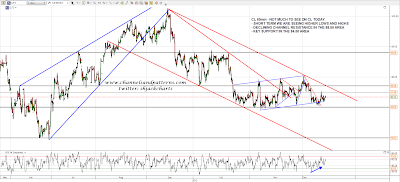
Not much of interest to report on CL today. Short term it is making higher lows and highs. Declining channel resistance is in the 88.50 area and key support is in the 84.5 area. A break in either direction over those levels should deliver a large further continuation move in that direction:
EURUSD looks very interesting this morning. As I suggested might happen yesterday, EURUSD tested the last high and the short term setup there now looks very toppy, with a short term double-top setup targeting the 1.296 area on a conviction break below 1.304. What is really interesting on this chart however is the much larger possible double-top targeting the November low on a break below 1.2875 – 1.2885 area support. The outlook leans bullish as long as the current rising channel holds, but is channel support breaks (currently in the 1.2935 area), the setup here on EURUSD would start looking grim. Short term reversal down looks likely, and we'll see what happens then:

I'm leaning towards seeing more downside on equities over the next couple of days, but it's possible we might see a strong bounce in that time. The key thing to watch on ES today is the declining resistance trendline that has formed from the recent high. That has three touches and is of good quality. If we are to see a strong bounce and possible retest of the highs, the warning signal will be the break of this short term trendline and then the break of the 50 hour moving average just above. The chart below is December ES, I'll be switching to March on Monday:

