
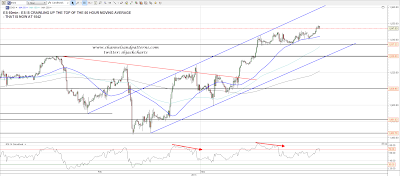
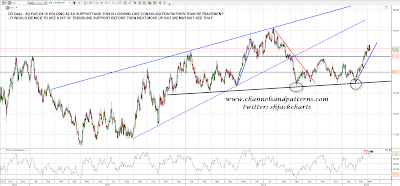
ES crawled up using the 50 hour moving average as support yesterday and has pushed up further overnight. The 50 HMA is at 1542 and strong level support is at 1537. Until the 50 HMA at least is broken with any confidence there is nothing to see on the bear side here:
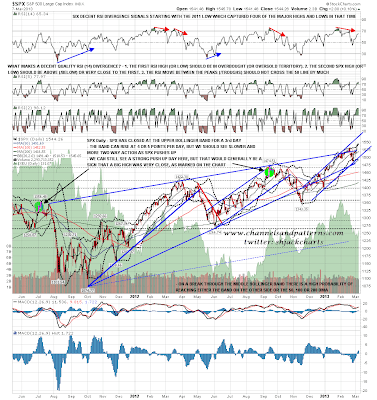
SPX closed very close to the daily upper bollinger band yesterday for the 3rd straight day. I mentioned that unless we saw some retracement the day was likely to be a boring crawl sideways and up, and so it was. I saw a suggestion that we might see a trend day up yesterday, and that is a possibility here, but would generally mean that a significant high, the Spring high in this case, was then very close. I've marked two previous instances of this on the chart:
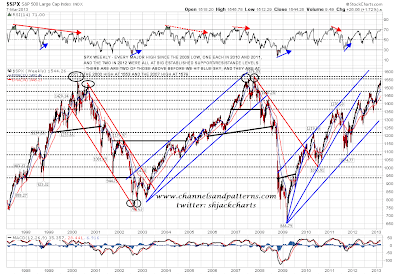
We are now very close to testing the 2000 high at 1553 SPX. This is a key resistance level and the first test of this level in 2007 was the first high of the 2007 double-top. We may well see some significant resistance there:
If SPX can get over 1553 then rising channel resistance on SPX is now in the 1565 area. Worth noting that there is still negative divergence on the 60min RSI, though that may well break up today. Only a strong push would exceed the previous RSI high though so a variant of this current divergence could still be visible at the next significant high:

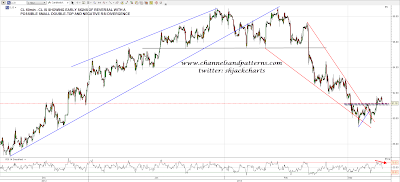
CL has broken over the double-bottom trigger level, but is showing signs of reversing back down, with a possible small double-top and negative RSI divergence. Support is in the 91.2 area:
EURUSD also showed signs of reversing back down, with a marginal higher high into 1.309 resistance overnight on negative RSI divergence. That is now playing out strongly and a test of the current lows looks likely. On the DX chart support at 82 has held so far as a consolidation range low and we might be starting the next move up:
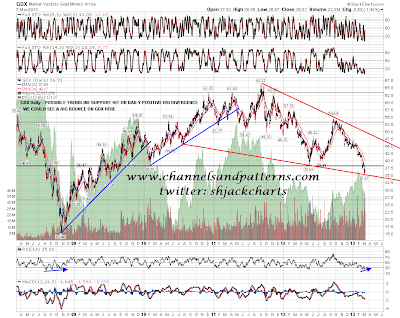
I was asked for my view on GDX yesterday. I have a possible reversal level at the current low, with possible trendline support and positive daily RSI divergence. We could well see a big bounce here:
I have strong trendline resistance on ES in the 1560 area today, which is a decent fit with rising channel resistance on SPX. If we see a punch that far above the daily upper bollinger band on SPX then, as I said, that would be a strong signal that a major high is very close, though I wouldn't normally expect to see this until the late March to early May period. 1553 SPX is a major established resistance level but if current ES strength continues into the open we could see a gap over it.
