
As I’m writing this the S&P is in beautiful new all time high territory. The concept of a correction has now been downgraded to, at worst, a gap down in the morning to be bought and at best, a five point intraday drop. This is the world we live in. And the consensus seems to be that this will continue for the foreseeable future. Every central bank in the world is printing, there is zero fear, and we are now in Livermore’s AOT market meaning “buy any old thing.”
So what happened the last time the S&P made new all time highs after sustaining a devastating crash? That would be 2007. I want to explore what happened last time the market broke to new sunny skies. As always I want to present charts with numbers and explain what these points mean.
2007
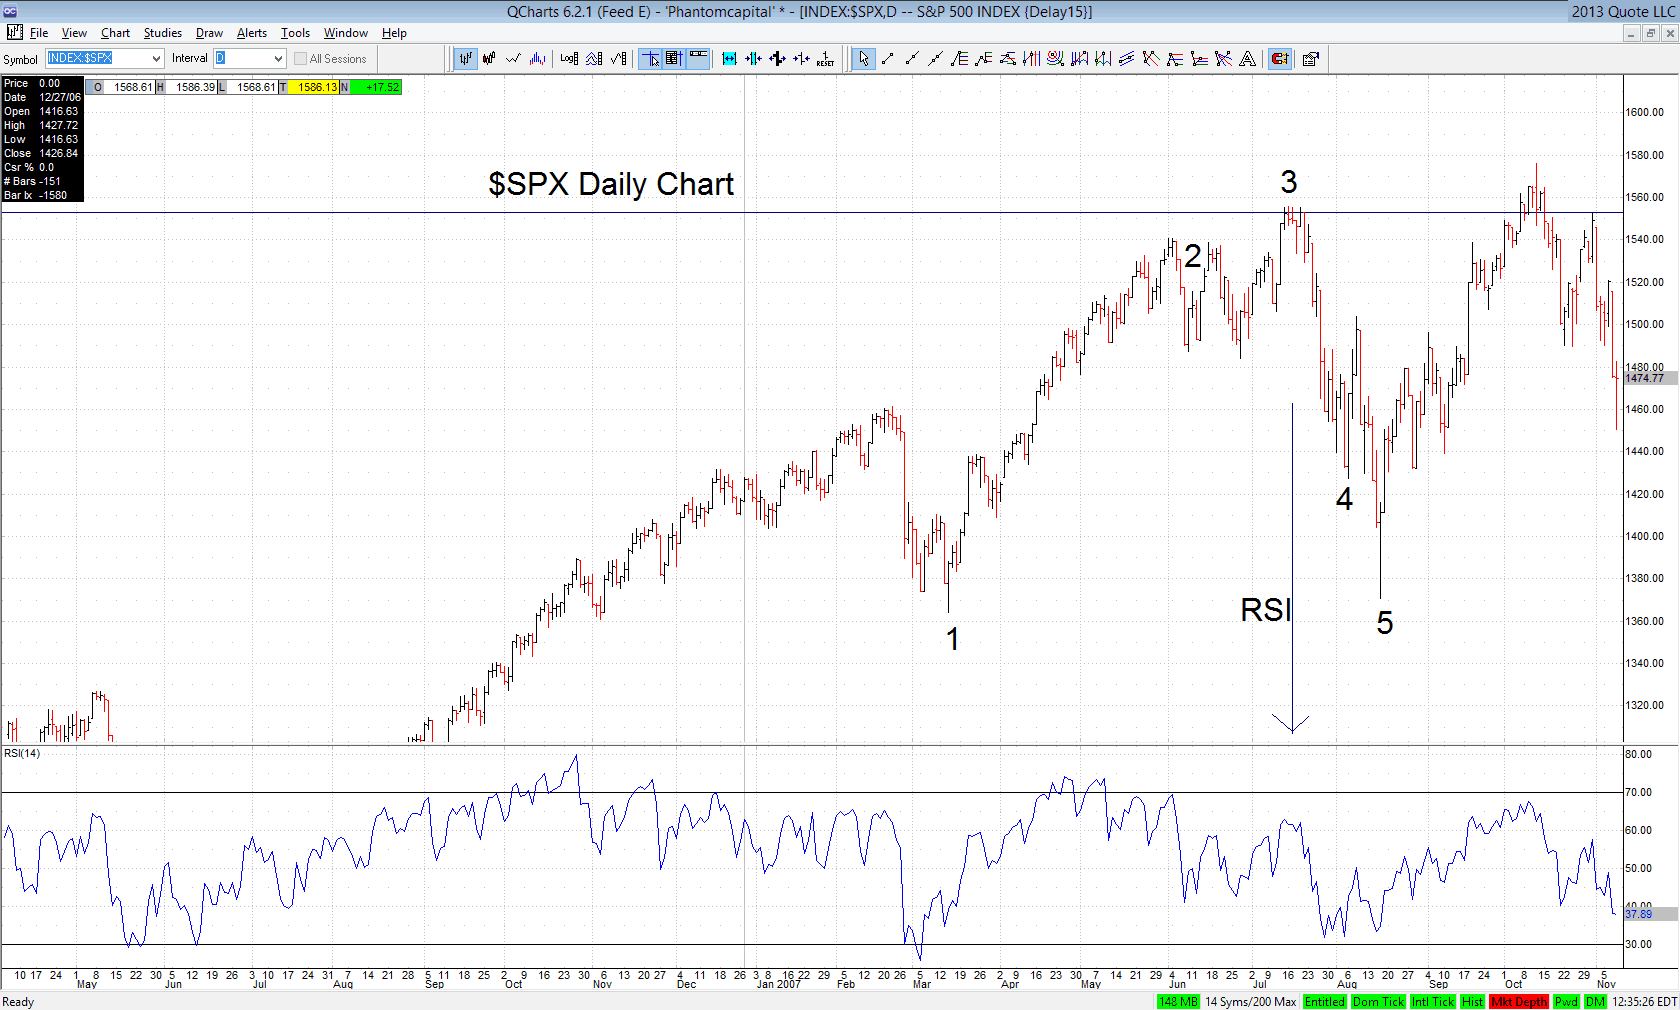
Point 1 represents a major low that marked the beginning of an uninterrupted run higher. This run in 2007 lasted three months with no major correction. Point 2 represents a month of significant chop JUST SHORT OF THE ALL TIME HIGH. The amplitude of this chop was roughly 50 points. Point 3 represents the 50 point three day rip higher to new all time highs. The horizontal line represents the 2001 high. Sunny skies indeed. Then the unthinkable happened. The market didn’t continue exploding higher. And three weeks later, Point 4 happened. As in a 120 point DROP (the thing that occurs when markets go down…yes its a hard concept to wrap one’s mind around). Point 5 was the end of the move, representing a full 180 point correction from the sunny skies top. Oh, and it happened to correct all the way back to Point 1. Lastly, check out the RSI. Lower highs as the market made higher highs.
2013
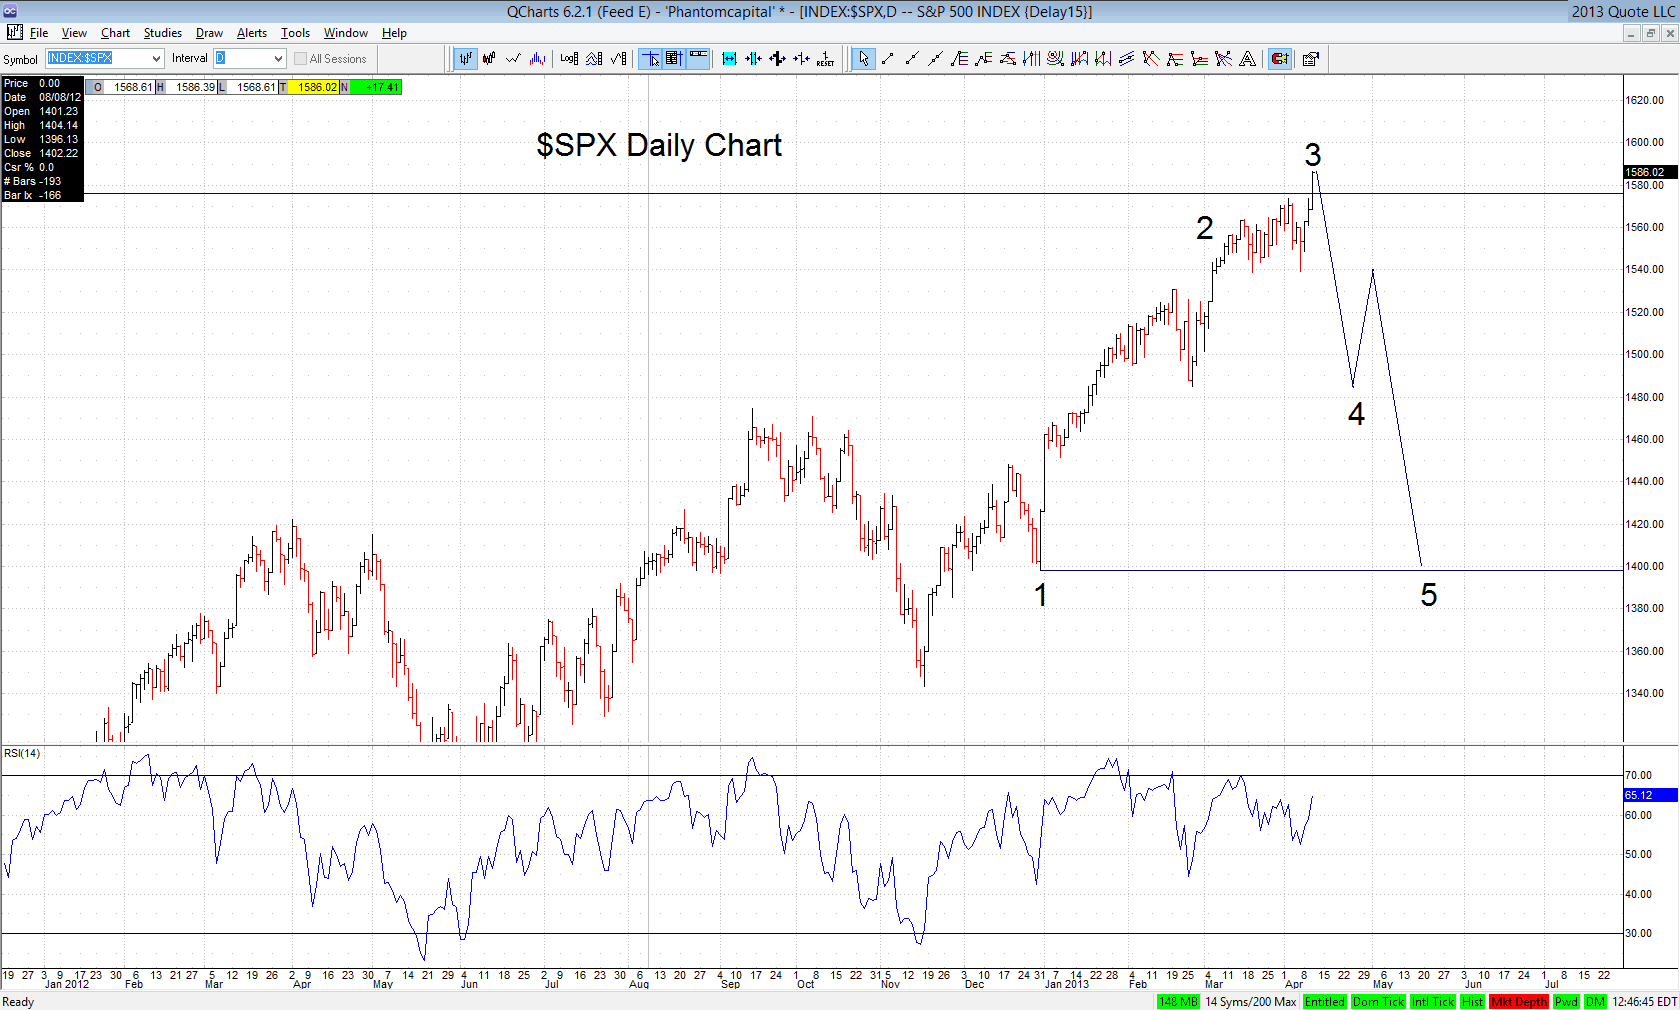
Point 1, major low marked by the resolution of the Fiscal Cliff. Point 2, significant chop just short of the high with an amplitude of roughly 30 points. Point 3, a 45 point moon shot higher to new all time highs. The horizontal line is the 2007 top. So far, the action is virtually identical. Anyway, Point 4, a correction back the February low is almost exactly the same amplitude as 2007’s first drop. Guess how much a drop to Point 5 represents? 180 points. Exact same as 2007. Oh, and see that tricky little RSI reading? Lower highs.
So bulls, I get it. This time its different. CNBC told you so. I mentioned in my post If It Ain’t Broke Don’t Fix It that the whole run should stop right around 1,590ish. Well, that’s where we are. I’m now looking for, at minimum an 80 point correction. At maximum, I’m looking for the full blown 180. Yes, this is blasphemy right now. Get long here if you think 1,700 is in the cards soon. However, I believe that gravity does actually exist. So I’m short.
