
I was getting some flak yesterday for saying that I thought that the wave up from November had ended and that ES and SPX were now in a topping process. Do I know that for a fact? No. That’s why I said that this was my opinion. It is still my opinion, though as I said yesterday morning, this is generally signaled with the formation of a double-top or H&S and neither of those is clear yet. I’m also looking for confirmation with a break below the rising channel on SPX since the November low.
Should I wait for strong confirmation before giving opinions like the one I gave yesterday? It depends on your timescale. The odds that we see a decent retracement here are good, and traders can play that or just look for the buying opportunity at the low. By the time we see strong confirmation however, much of the action may be over and I may well have started looking for a tradeable low. This is just my opinion, and I’m right a lot of the time, it’s just a technical appraisal of the odds however. I have a crystal ball but I’ve never managed to get anything useful out of it. The forty bucks I paid for it on eBay was wasted I fear. 🙂
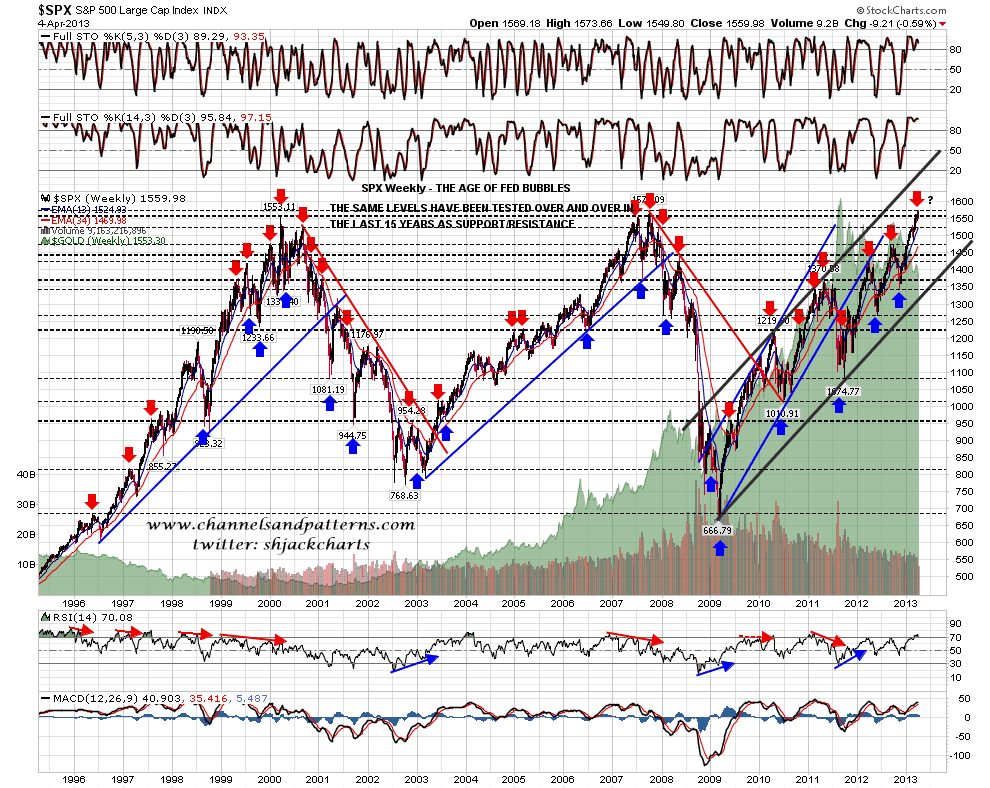
I have been talking for weeks though about the very decent odds that we would see a strong reversal at either the 2000 high or the 2007 high. Why? SPX has a very strong history of making significant highs and lows at established levels, and these are the last established levels before SPX hits blue sky. To show how strong that history is I have marked up a fifteen year chart to show the significant highs and lows over that period. Look for yourself. Apologies if I missed a couple of arrows but you can see what I mean when I say that almost every significant high or low since March 2009 has been at an established level:
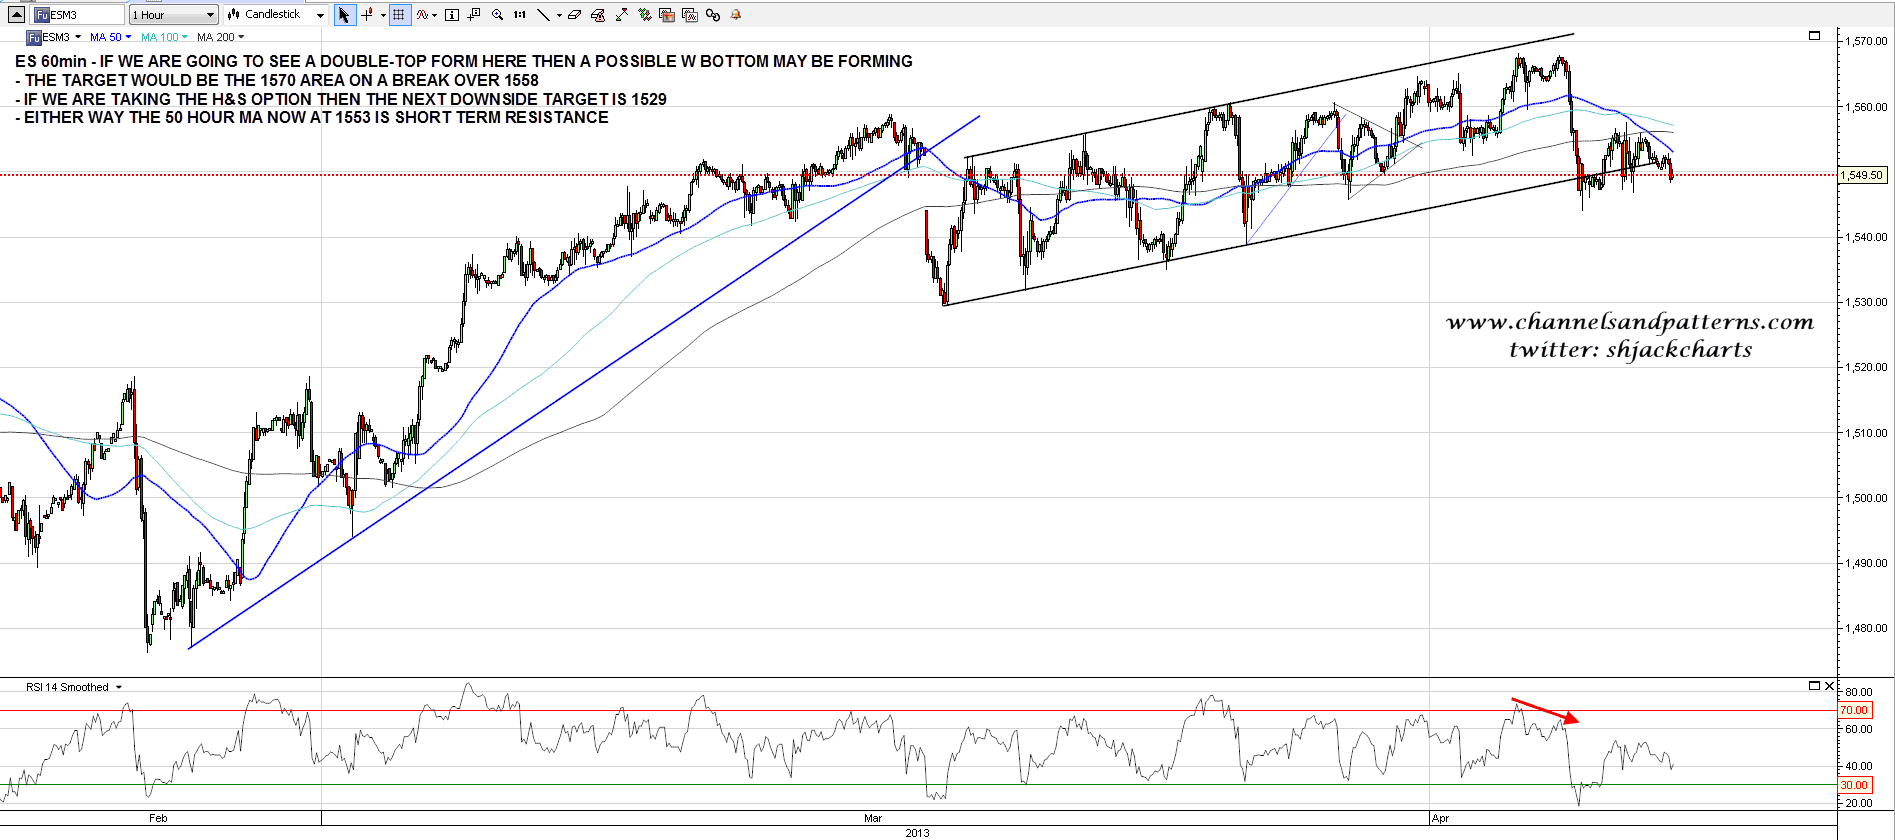
So what now? There are some important numbers out this morning and that may well have a significant impact on the day. As we stand here the double-top and H&S options are still both in play. ES may be forming a double or W bottom here to take it back to retest the highs. Short term resistance is obviously at the 50 hour moving average and a clear break back above would strengthen this scenario:
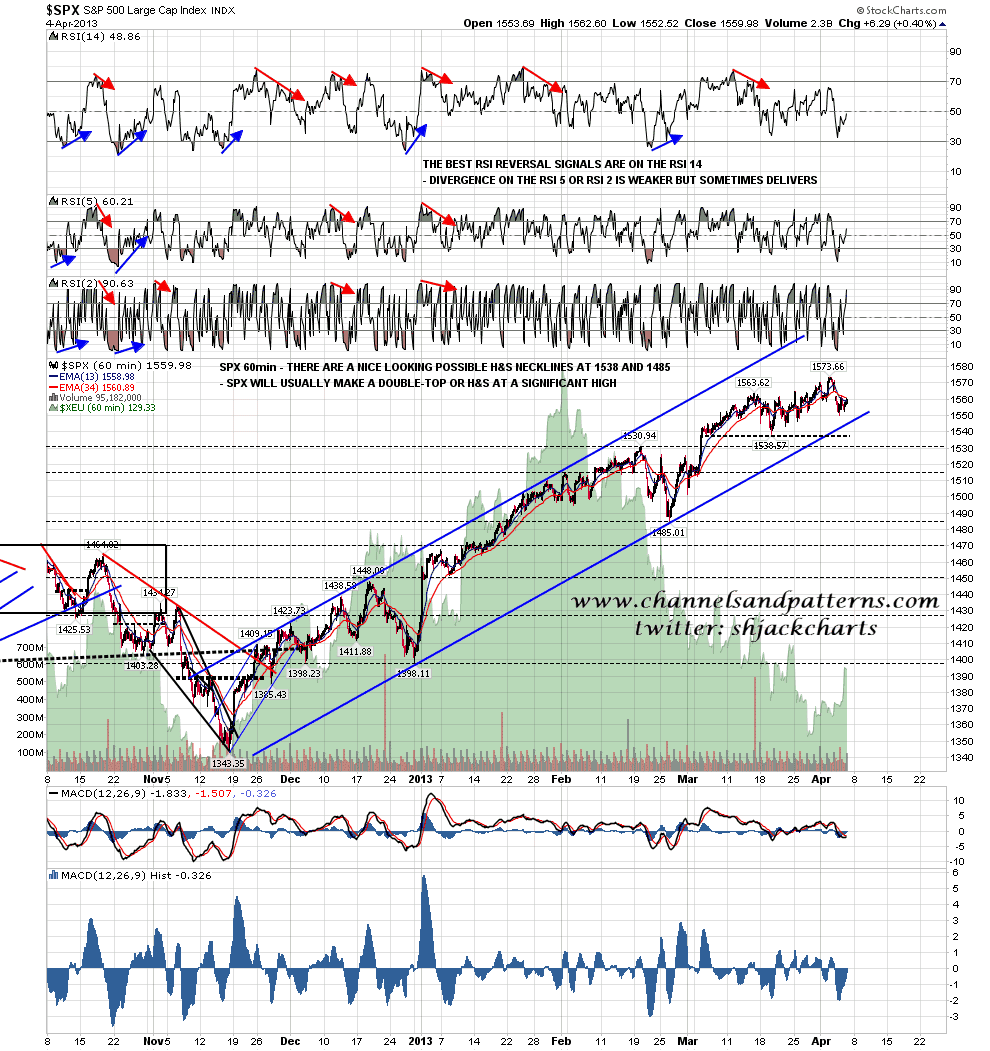
The main H&S scenario I’m looking at has the neckline in the 1438 SPX area, and if we see that area made then the SPX rising channel will be broken:
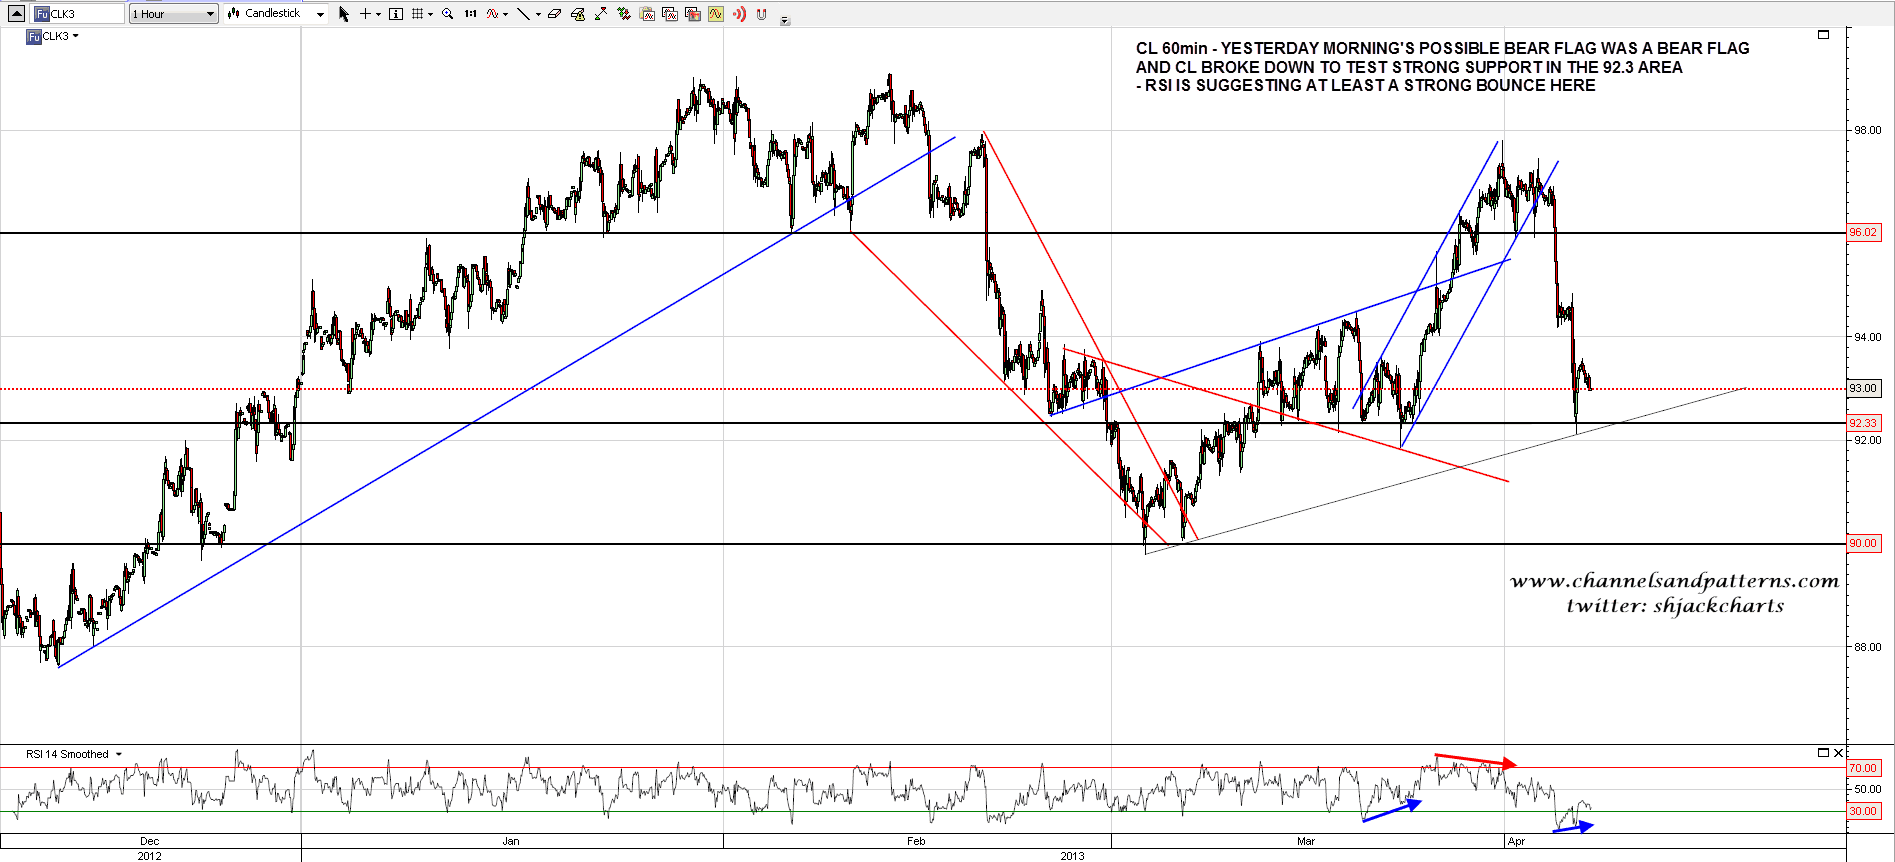
On other markets the possible bear flag on CL from yesterday morning was indeed a bear flag and CL has been testing strong support in the 92.3 area. The 60min RSI is suggesting a decent bounce from there:
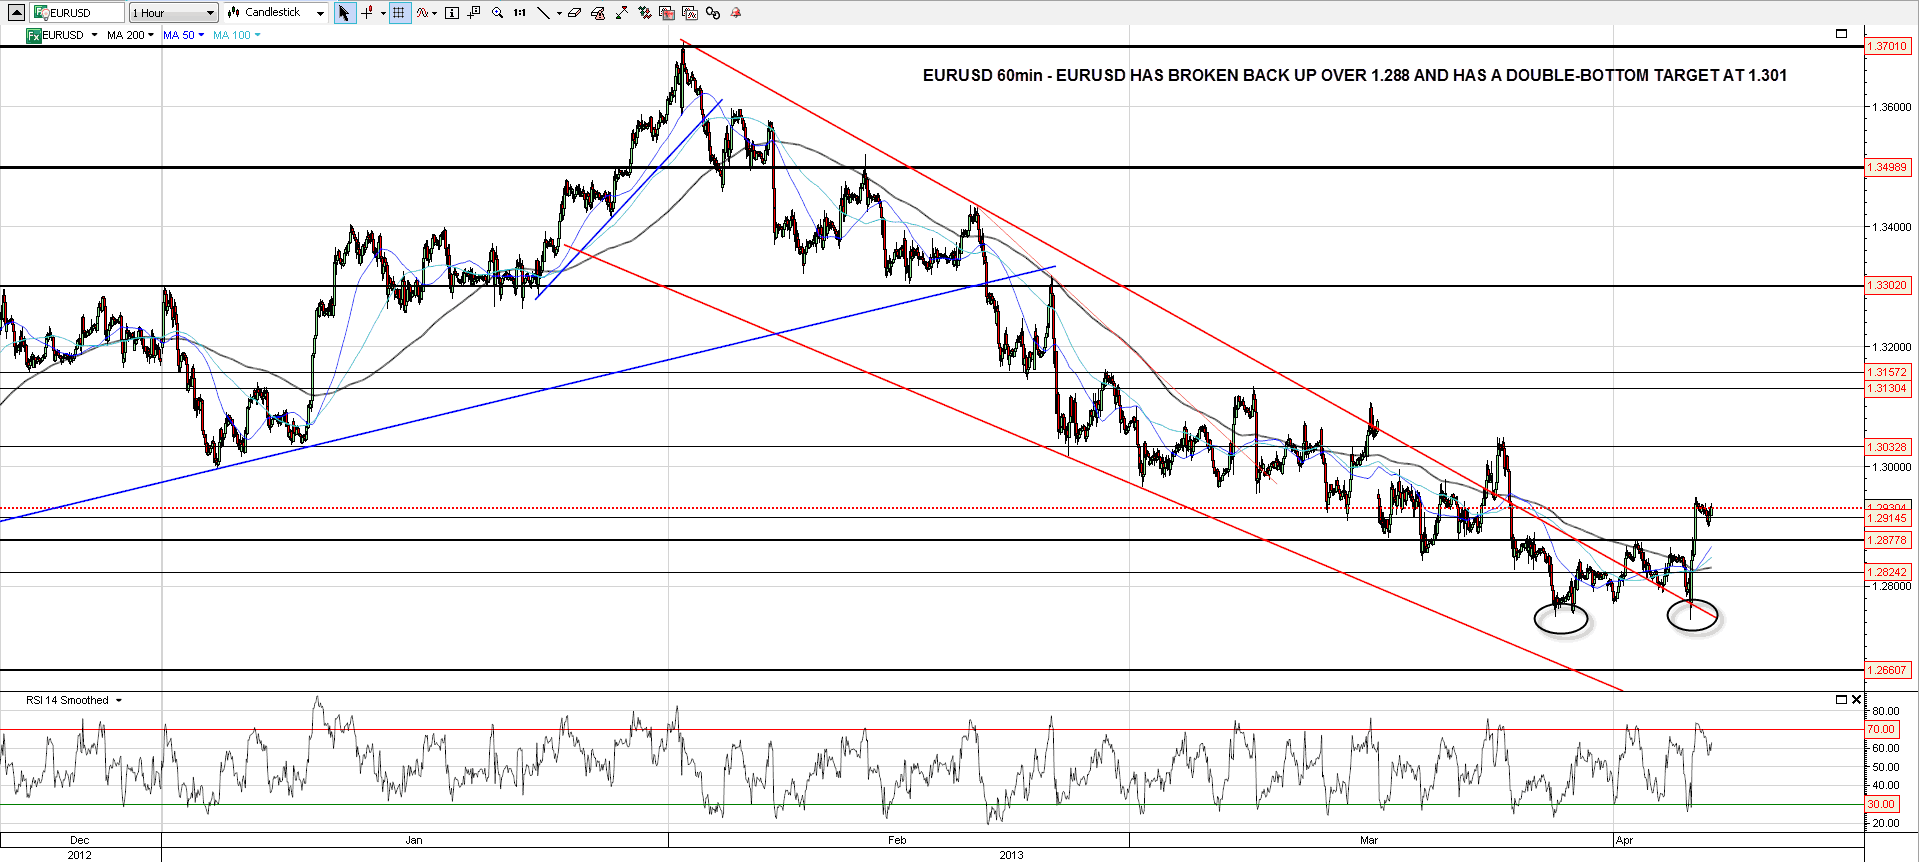
EURUSD has broken back up over 1.288 and that has triggered a double-bottom target at 1.301. The current consolidation looks like a bull flag:
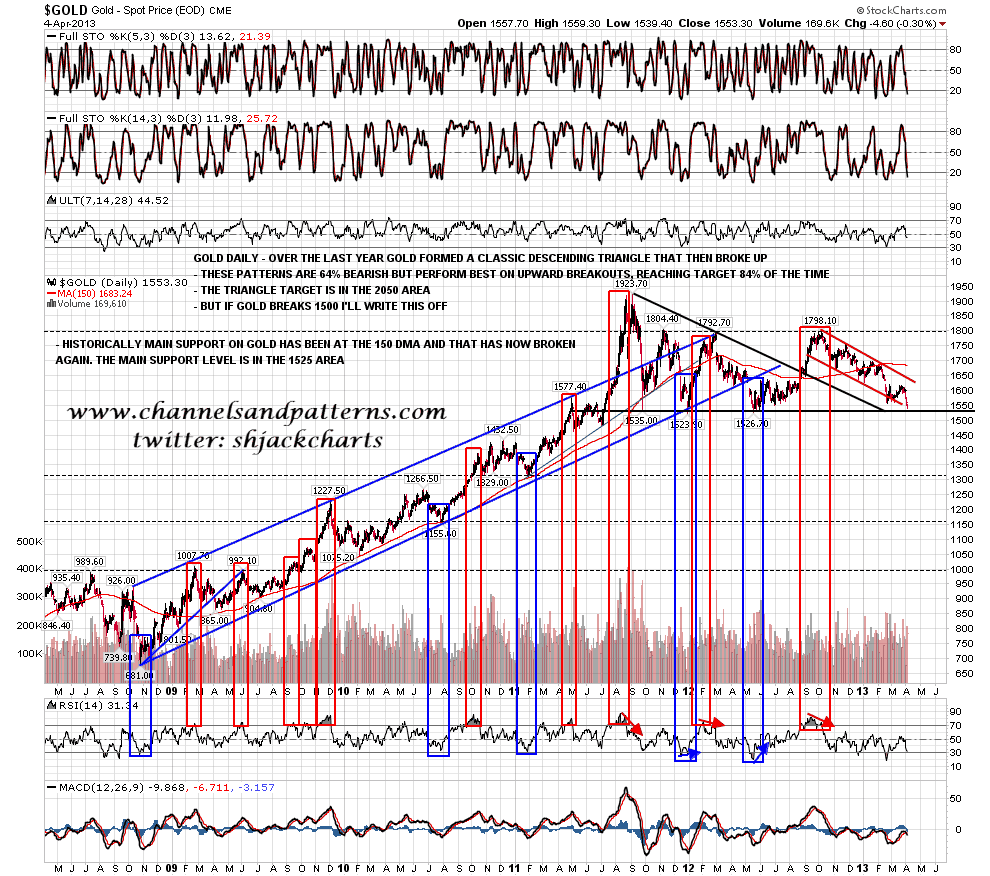
I’m going to have a look at gold and silver today as they are both close to their main support levels. On gold the main support level is in the 1520-40 area and the low yesterday was at 1539.40. Not seeing any obvious signs of reversal here but this is a very strong support level. If it breaks I have the next big levels in the 1330 and 1150 areas:
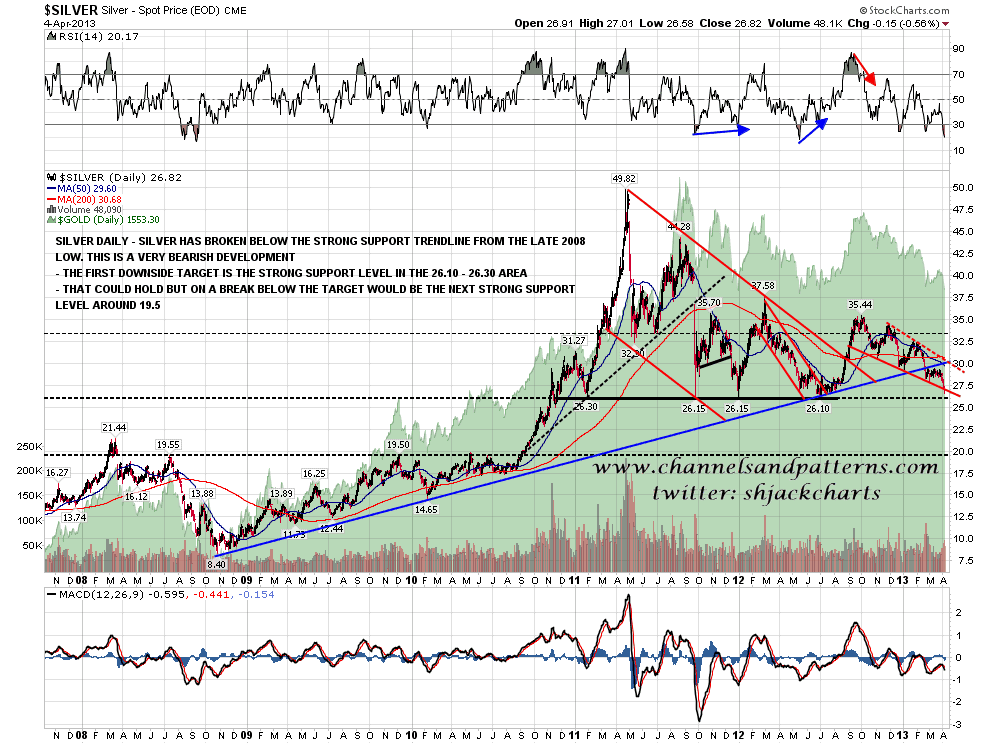
On silver main support is in the 26.15 to 26.30 area and the low yesterday was at 26.58. If main support breaks the next obvious target is at 19.5. Silver’s recent break of rising support from late 2008 has me leaning somewhat bearish here and again there are no strong signs of reversal here as yet:
As I’ve been writing this ES has been declining steadily and has now undercut Wednesday’s low. The double-bottom to make a double-top scenario is still in play but ES is now obviously making lower highs and lows. We shall what this morning’s numbers look like.
