
The triangles on ES and SPX have continued to develop since yesterday and are now very clear, though both a little rough. ES has retraced to test triangle support again overnight and that is now a very well established support trendline. Here’s the triangle on the ES 60min chart:
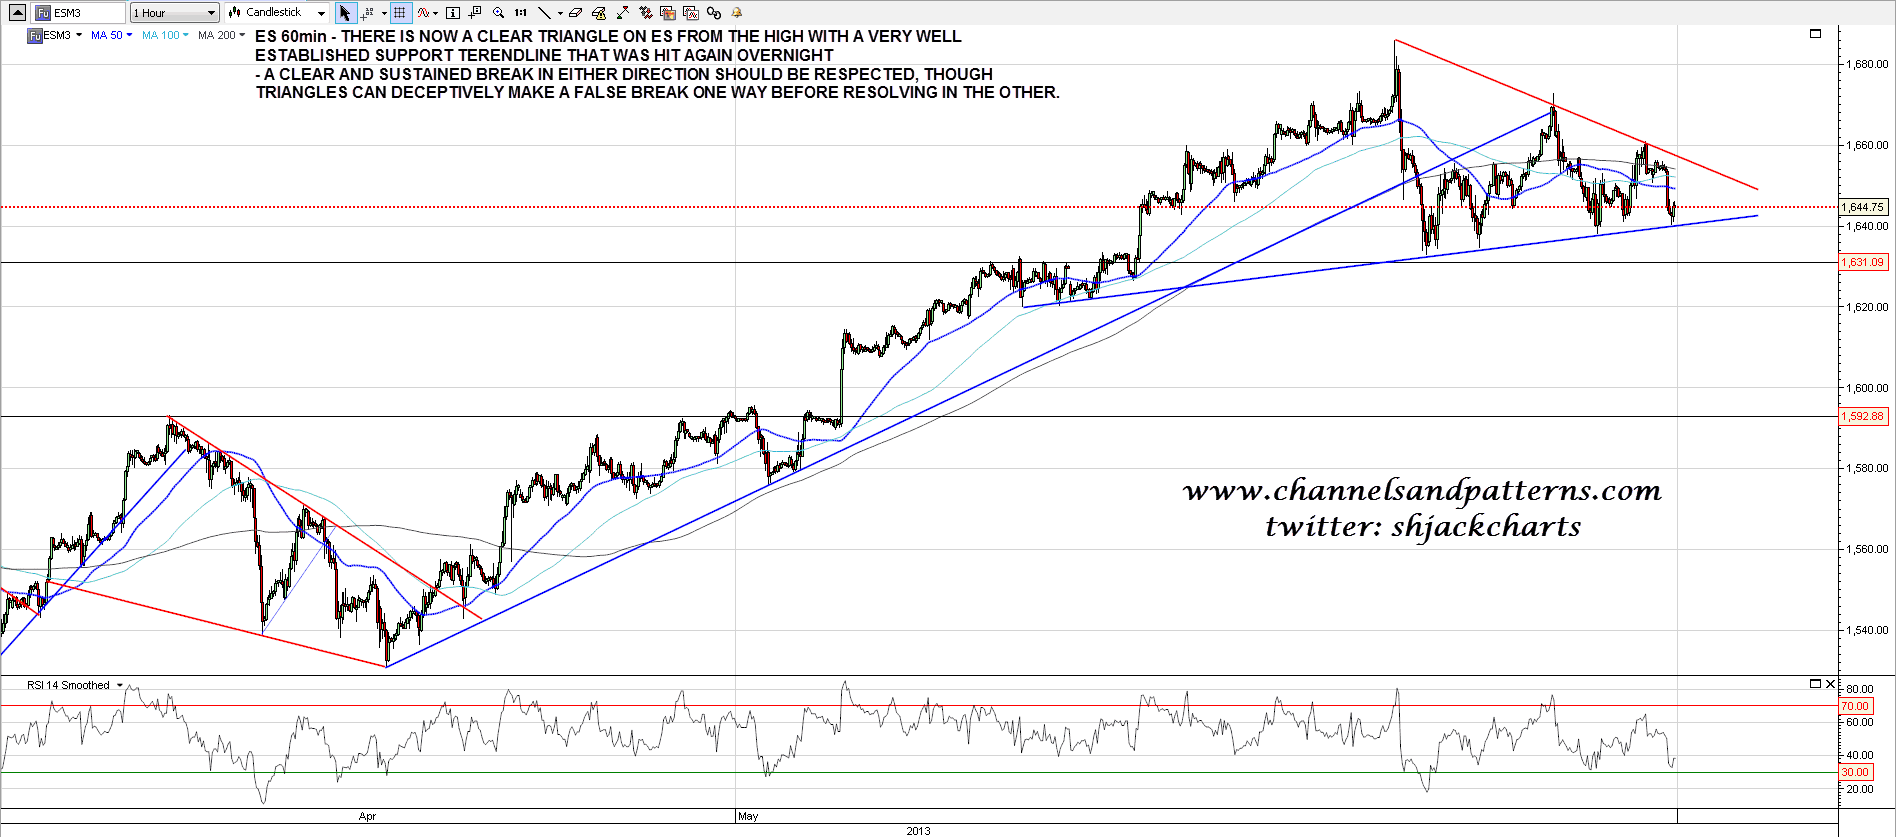
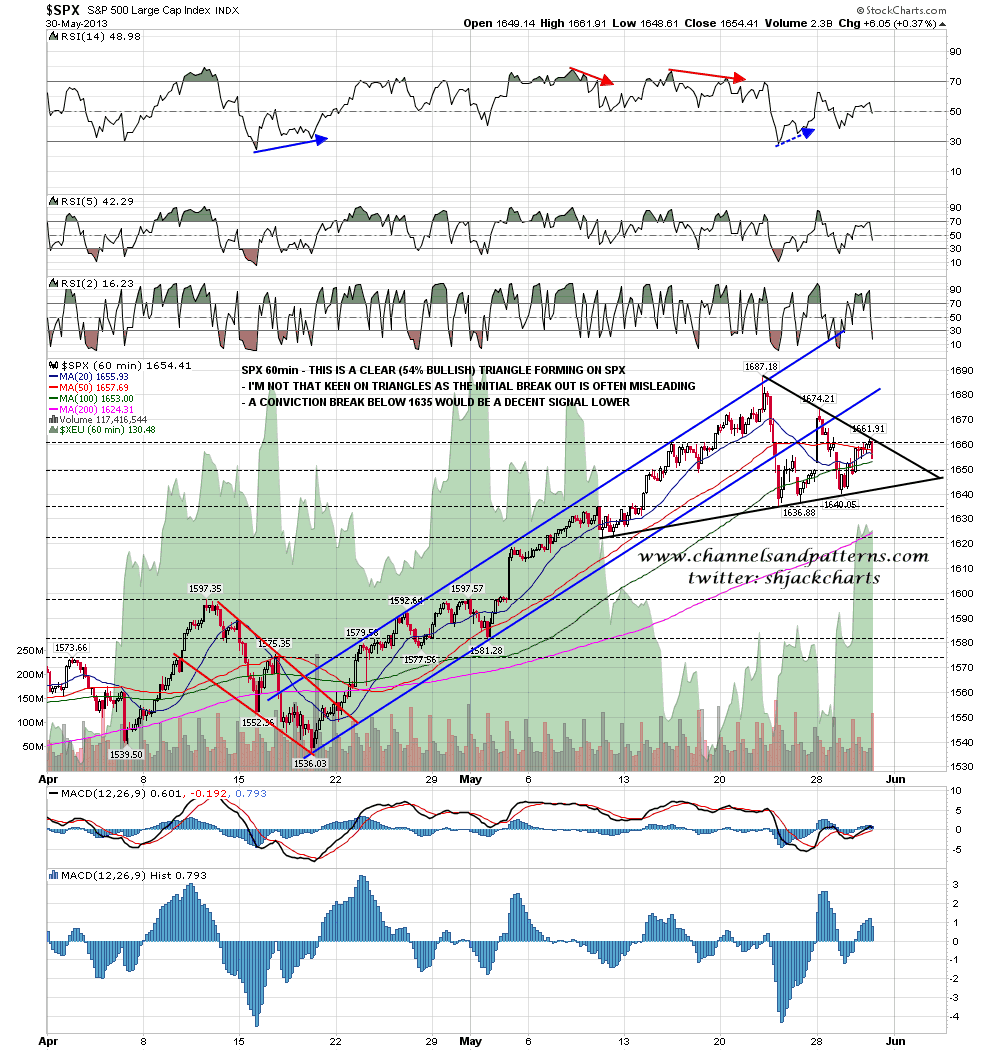
Now it was mentioned yesterday that triangles like these are bullish and that’s right, marginally. Bulkowski has these breaking up 54% of the time, so perhaps it would be more accurate to say that it’s on the bullish side of random in terms of direction. Regardless of that a clear and sustained break in either direction should be respected. I say sustained because as I mentioned yesterday, triangles have a nasty tendency to make a false break in one direction before playing out in the other direction, so it’s best to trade these cautiously. Regardless of that, any move below 1635 SPX should deliver a move to test the 1580-1600 area. Here’s the triangle on the SPX 60min chart:
I’ve talked about downside targets a lot over the last few days so I want to look at upside targets today. If we are seeing a break up from a triangle then it may well not be a simple retest of the highs, so I want to look at the trendline targets that I have beyond that. The first of course is the broadening ascending wedge resistance trendline, and that’s now in the 1695-1700 area:
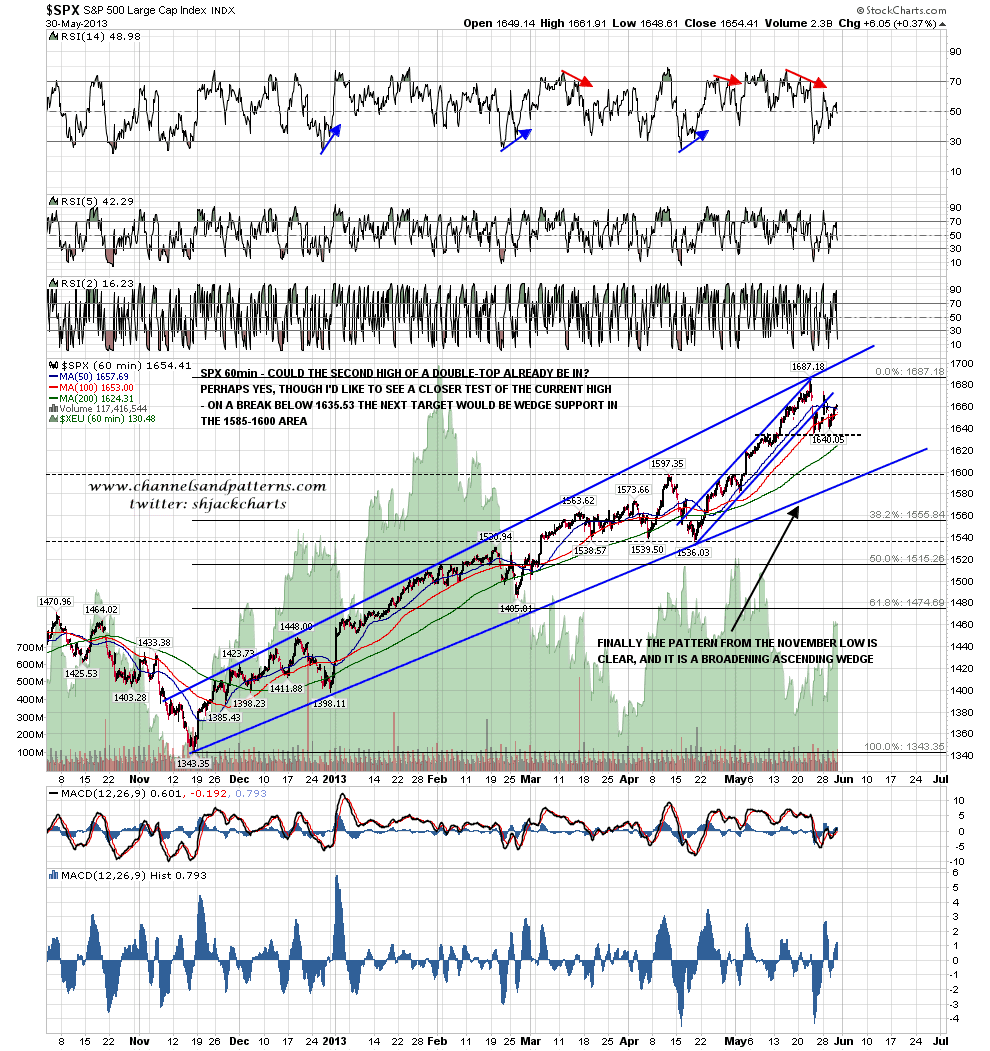
The second trendline is the currently entirely theoretical potential channel resistance for the bull market since October 2011. I’ve mentioned resistance in the 1700-20 area a few times and this is one of those two resistance trendlines. Generally I would expect a bull market on SPX to form a rising wedge, a channel, or a broadening wedge, and the rising wedge option was killed last year. This possible channel trendline is a contender and here it is on the SPX daily chart. Also worth noting on this chart is the way that the daily middle bollinger band (also the 20 DMA) has clearly acted as support in recent days:
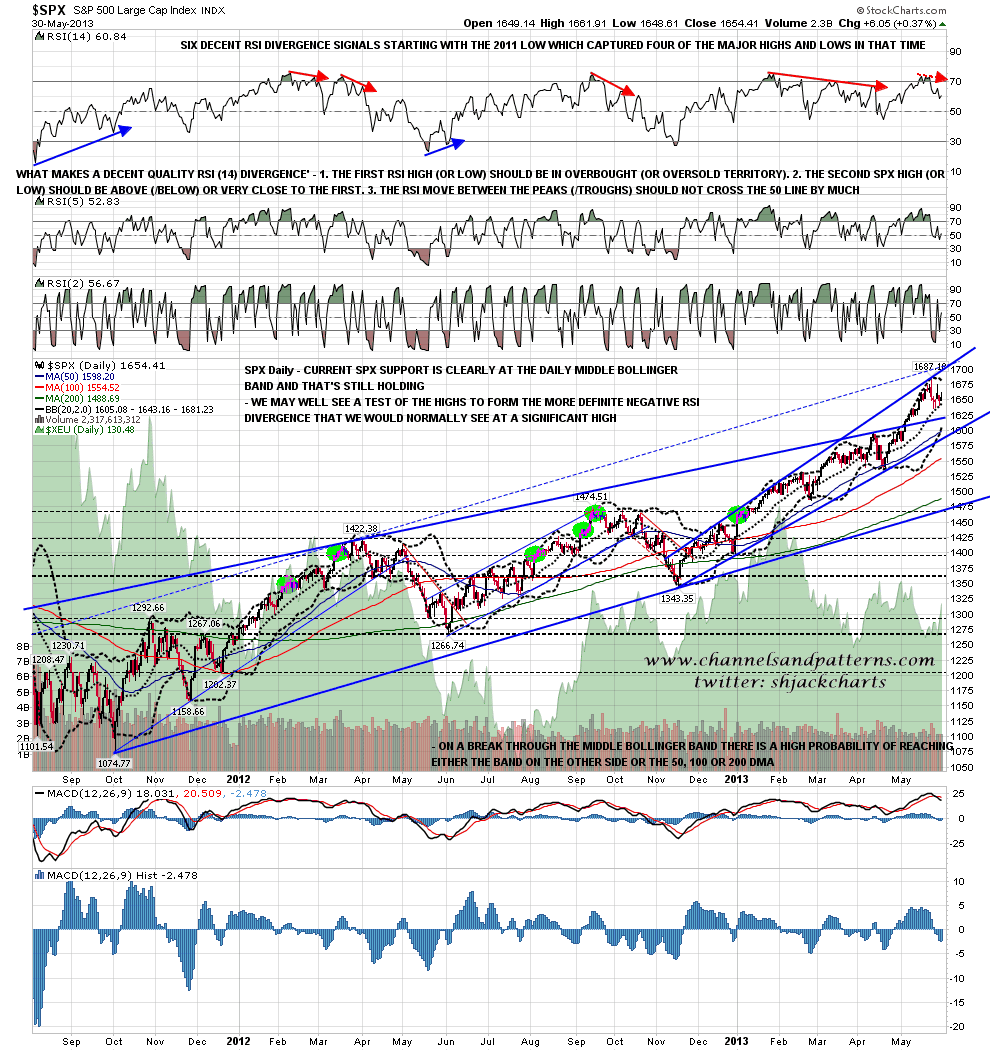
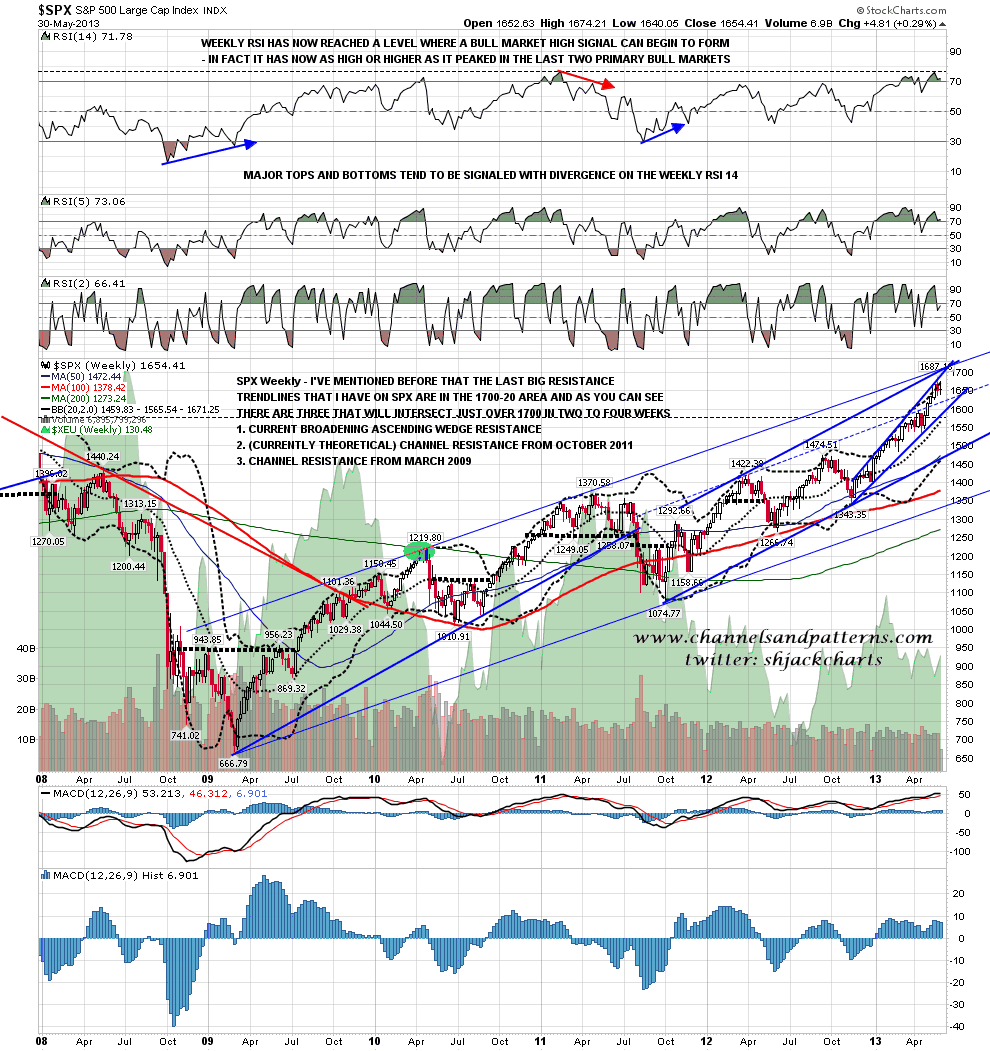
The third resistance trendline to watch is shown on the SPX weekly chart below. This is currently just above 1700 by the look of it and as I have drawn all three on this chart you can see that these trendlines will all intersect in two to four weeks, which makes for a compelling target. Worth mentioning as well on this chart is that the weekly upper bollinger band will most likely close in the 1670-5 area today, and as this can only rise at 10-15 or so points per week, then it would take two to three weeks to get into the right area to hit those trendlines. We have seen a break over the weekly upper bollinger band recently, but these are rare and we may not see another for a year or two:
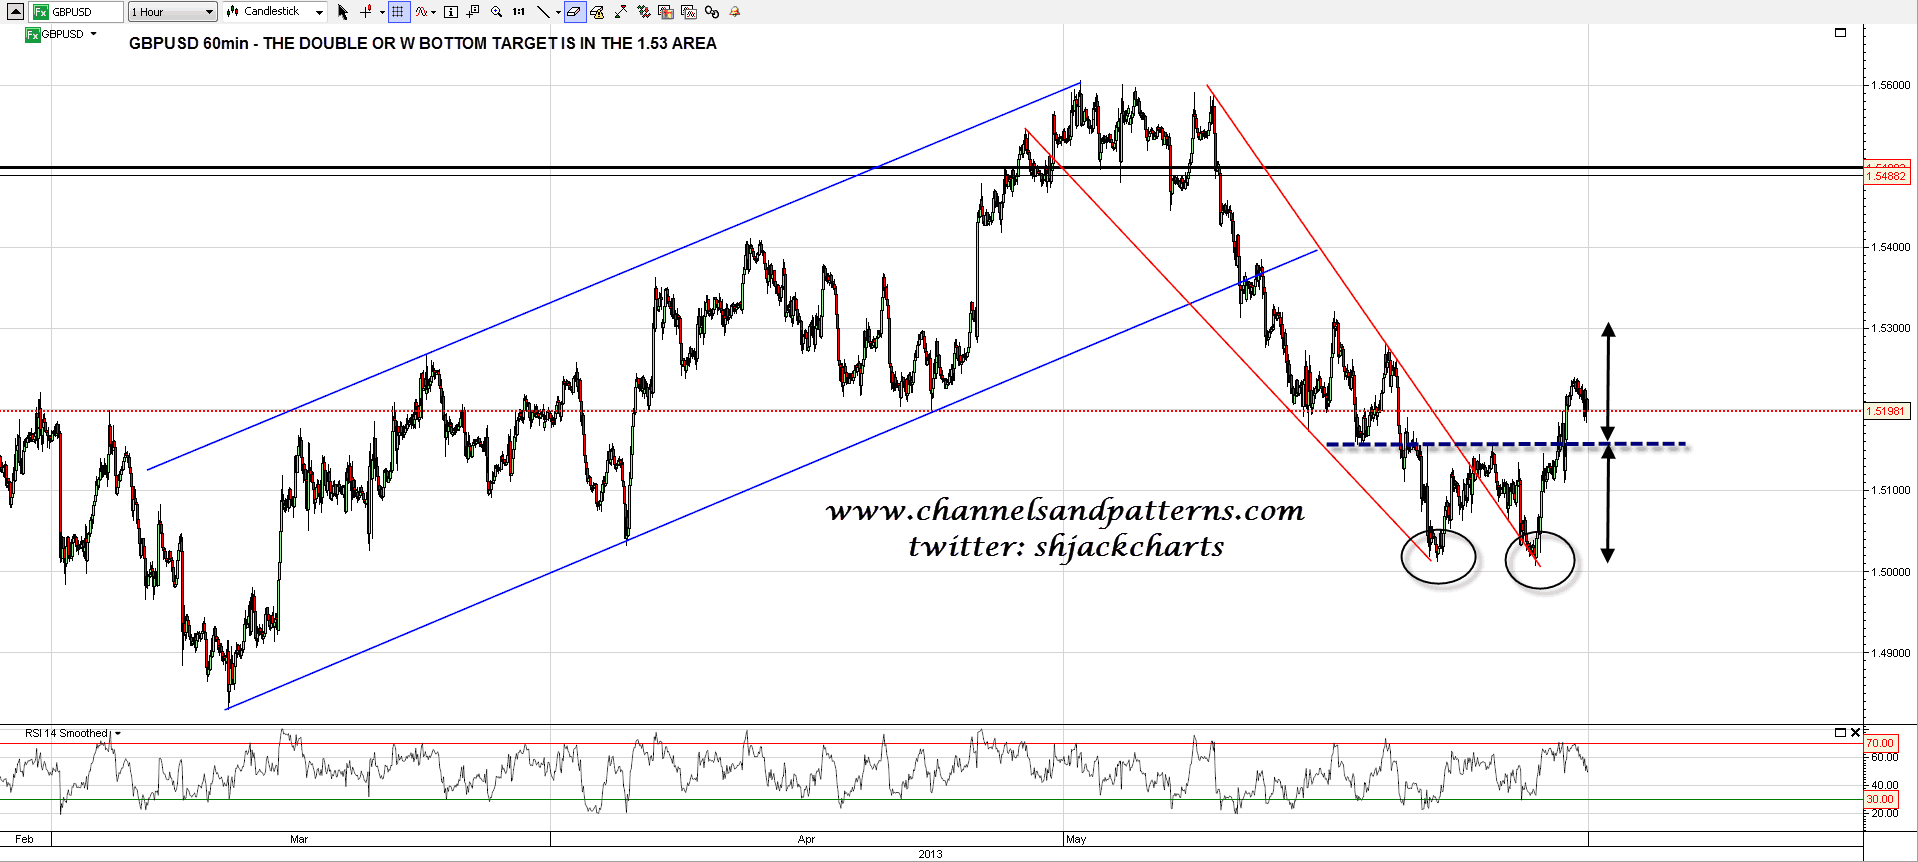
The GBPUSD W bottom I’ve been following still hasn’t made the 1.53 target area, but most likely it will soon:
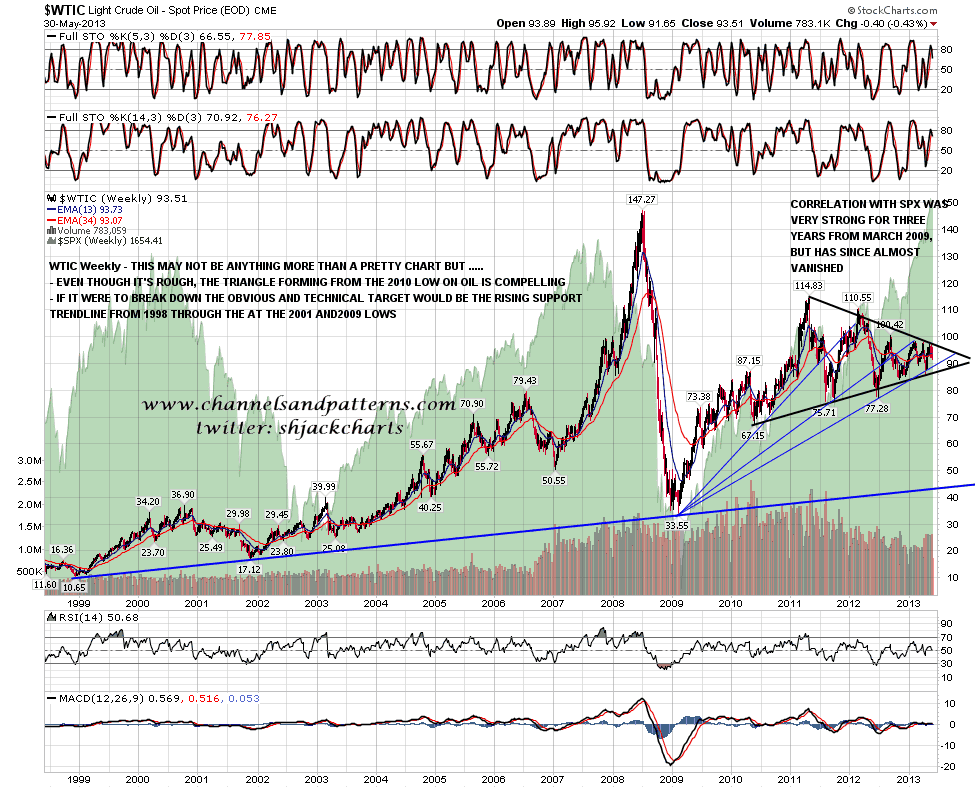
I’ve been giving some thought to the setups on the CL and USD charts this morning, and will close with a couple of fairly blue sky charts on those. First the CL chart, where CL is trying to break down from a double-top, though not with much conviction so far. I’ve been looking at the long term WTIC chart this morning, and considering the merits of a triangle there that has been forming since the 2010 low on oil. The triangle is a bit rough, though I’d mention that the only break of triangle resistance on the weekly chart is just a pinocchio on the monthly chart. The next target within the triangle would be triangle support in the 86/7 area, and on a break down from the triangle we might well see a drop to test the long term support trendline from the 1998 low through the 2001 and 2009 lows. The trendline setup is a series of breaks and retests which has a bearish cast to my eye:
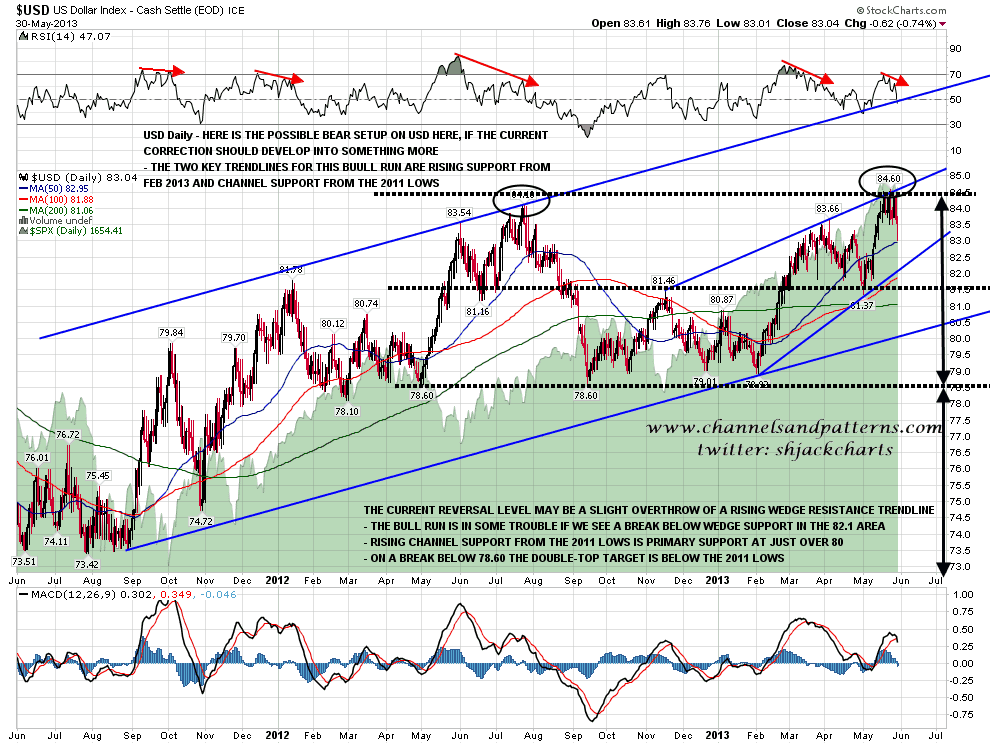
The last chart is a bearish take on the USD chart here. I’m bullish on USD still, but I have to say that the significant reversal just above the 2012/3 double-bottom target at 84.5 is concerning me. At the moment that looks as though it might be a rising wedge overthrow and, if so, the next target would be a test of rising wedge support in the 82.1 area. If that broke the overall bullish scenario would be in question and the next support trendline would be rising channel support from the 2011 lows, now in the 80 area. If USD broke below 80 then we would most likely have a major trend change, and the next big support level would be at 78.6. On a conviction break below 78.6 we would have a double-top target below the 2011 lows. I’m not saying this is likely but I am just pointing out the levels and path if this current reversal develops into something more, and noting that marginal new highs or lows can often be the end of a trend. A break with confidence over the current high should kill off this USD bear scenario:
Support and resistance on ES and SPX is clear, though I would give the SPX chart priority in the event of a difference between them. A clear (and sustained) break in either direction should be respected. Everyone have a great weekend 🙂
