
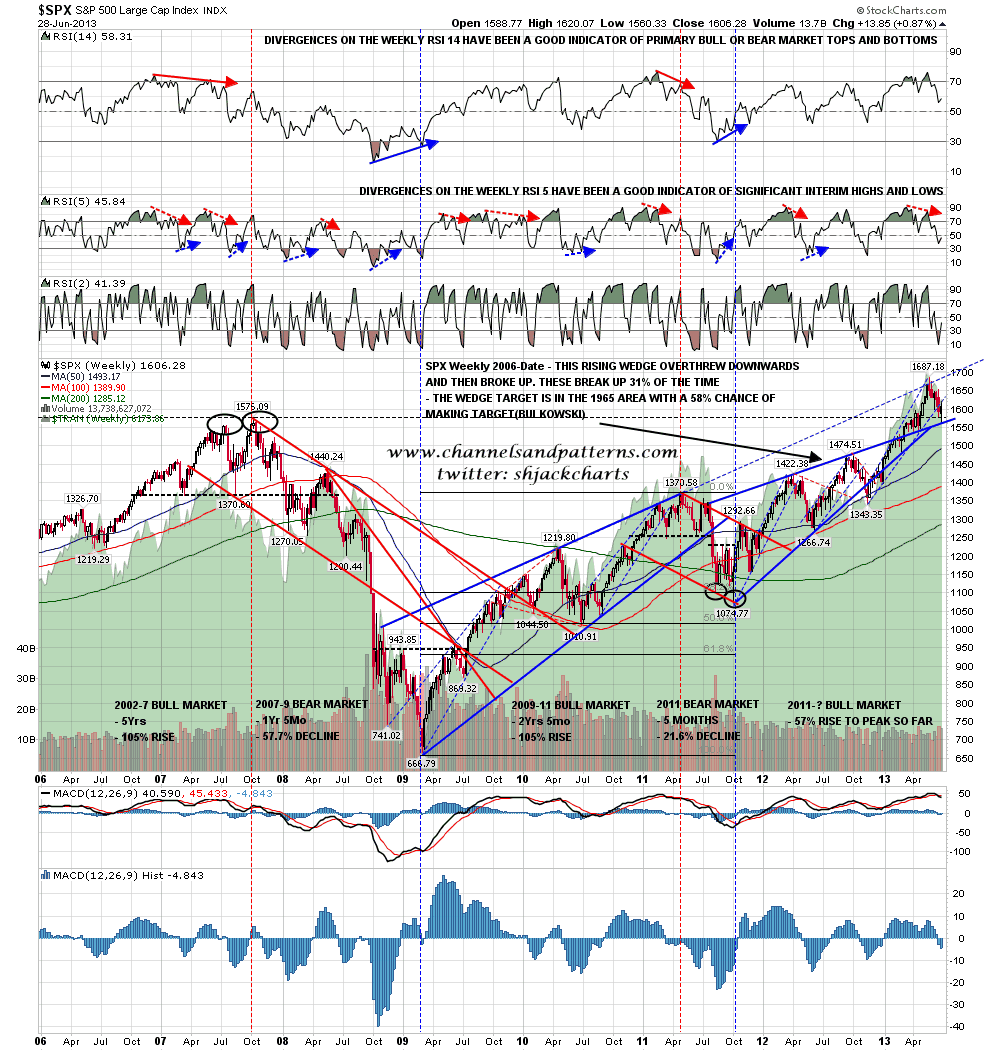
I’ve posted the chart for the rising wedge that broke up on SPX this year a few times with the comment that the upside target was 1965, but haven’t added much to that because I was planning to look at this pattern target in detail in this dedicated post.
It has to be said that there are a lot of people having serious doubts about the overall bull case here, and thinking that 1965 looks a long distance away still, but really it isn’t far at all if we turn and consider the road behind us that has already been traveled. From the March 2009 low SPX has advanced 141%. If this pattern target is made then that would increase to 195% That’s a significant increase for sure, but most of the distance covered has already been covered, and to reach that target requires only a 22.3% increase from here.
Furthermore the primary bull market from October 2011 has only advanced 57% trough to peak so far, and the only primary bull market since 1974 that rose less than 100% was the 1987-90 bull market at 70%. A move to 1965 would increase this to 82.8%, which would still be small by historical standards. I have explained how I am dividing primary bull market periods in my post yesterday which you can see here, but both the 1987-90 and 2009-11 primary bull markets would still end in the same place on the standard view as the subsequent decline was more than 20%.
Here is that pattern on the SPX weekly chart from 2006. The wedge underthrew (or overthrew downwards) as a signal that it was going to break up, and then broke up earlier this year. The target is the 1965 area. If the current retracement low at the retest of broken wedge resistance holds that will strengthen the target, though a deeper retracement that stayed above 1474.51 wouldn’t invalidate it. SPX weekly chart from 2006:
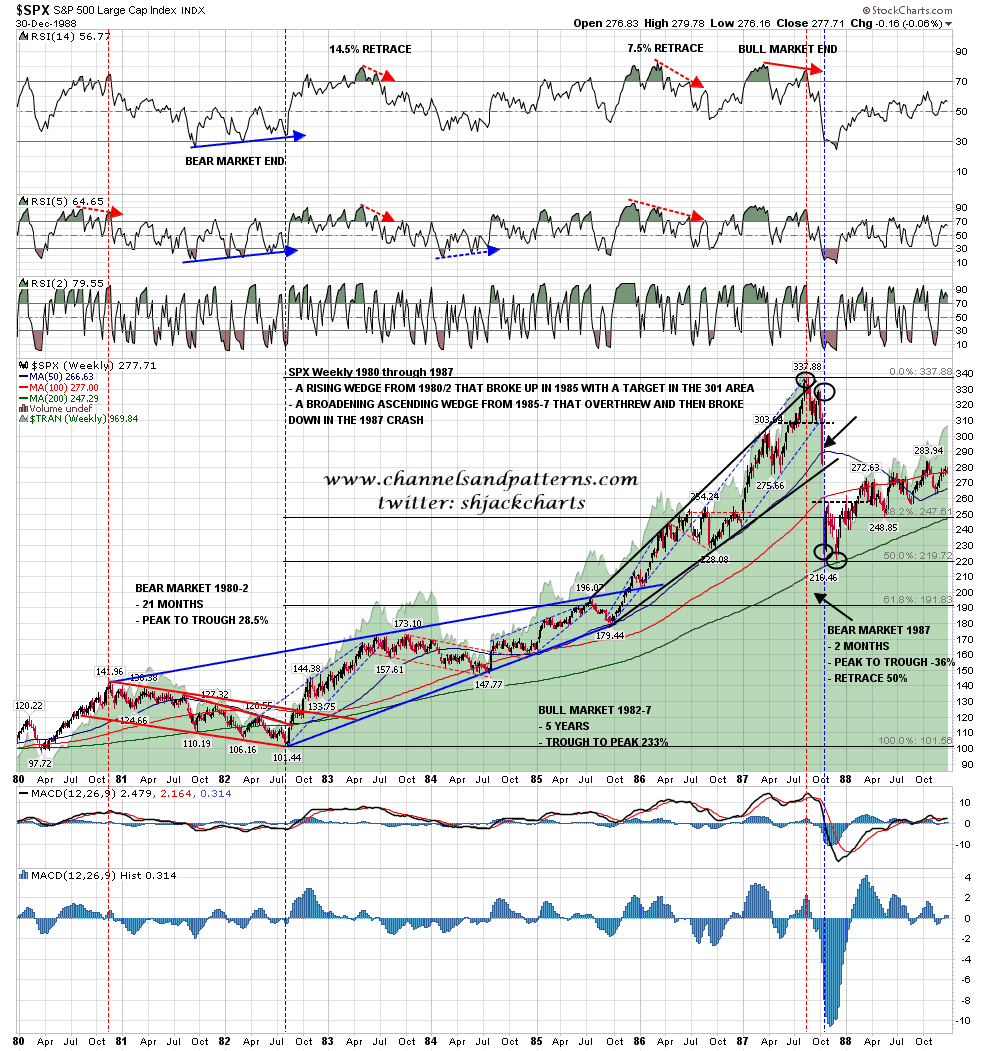
The first question to ask is whether there are any previous examples of this happening on SPX? There is one very clear previous example of this happening on the linear SPX chart when a rising wedge that started to form in 1980 broke up in 1985 with a target in the 301 area. The 2007 high was comfortably over that target at 337.88 so the target was made. This is a very clear example of a rising wedge breaking up as there was no underthrow before the wedge broke up, and therefore no possible argument that the wedge broke down and failed rather than breaking up. Here’s that wedge on the weekly chart from 1980 through 1987:
The next example is less clear but still qualifies in my view, though I would generally disregard this target if I saw this setup because the wedge broke up after the rising wedge trendlines had crossed. This weakens the setup in my view but the following move still broke up through wedge resistance further up the line, and the retracement after this pattern was only 24.9% of the previous move, close to the 23.6% fib retrace but very well short of the 38.2% fib retrace that I would treat as a primary bear market. As in absolute terms the move was only 9.8% peak to trough this would also not qualify as a primary bear market on the standard view. Here is that 1990-4 wedge on the SPX weekly 1987 through 1994 chart:
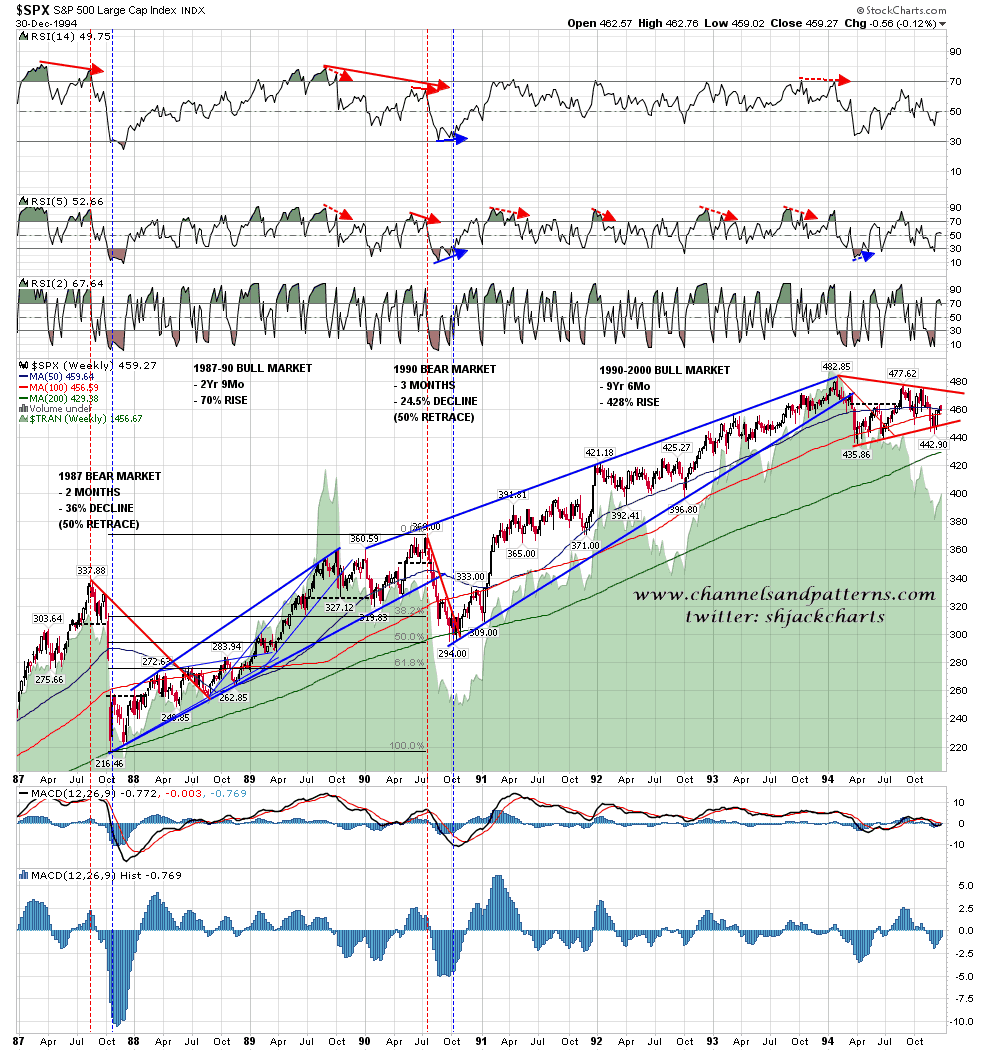
The pattern that followed this rising wedge was a consolidation symmetrical triangle and if I was to treat this wedge as valid I would calculate the target as a rise of 188.85 points on the conviction break over the wedge high at 482.95. That gives a target at 671.8 and the top for the broadening ascending wedge that followed was at 681 at the 1996 spring high. I would take this example with a pinch of salt but it did make target so …..
Here’s that setup on my chart of the 1990-2000 primary bull market and 2000-2 bear market. This primary bull market was so large that I normally split it into three parts to see the earlier patterns clearly, but you can still see this rising wedge and the broadening ascending wedge that followed it that made the wedge target. SPX weekly 1990 through 2003:

Obviously that is only two previous examples, one of which is questionable, but I’ve said before that on the higher degrees, a sample that only goes back to 1925 on SPX isn’t actually a large sample, particularly for patterns that only break up 31% of the time on Bulkowski’s pattern statistics. On Bulkowski’s stats rising wedges make target on upward breaks 58% of the time, and this fits or is somewhat more pessimistic than my personal perception that breakouts like these make target most of the time. As all these moves subdivide into subsidiary patterns of the next degree down we should also get some warning if this target isn’t going to be made.
What about the economic backdrop? Well I’m not a fan of Fed economic policies but hey, we got this far so why not? If we are going to see failure we should get some warning from the charts. Crashes are generally only entirely unpredictable if you are not a chartist. Consider the 1987 crash shown in the second chart in this post. The move into the previous high was framed by a broadening ascending wedge that would have had any decent pattern chartist out of longs near the high, and the wedge overthrew giving a strong signal that it was about to break down. An obvious target for the decline after the breakdown was the cross of the 200 week MA area with the 50% fib retracement of the primary bull market from 1982. Charts wouldn’t have given you the timing and speed of the crash, but the bear market itself and the depth of the retracement shouldn’t have been a surprise for good chartists.
The 2000 high was also well signaled and the subsequent bear market was straightforward though the 2007-9 setup was less clear from the charts, as the double-top only targeted 1170 and pure chartists might have been considering longs at 1200. I would add to that though that the first weekly RSI long signal only came after the 741 low so ….
I’m also much less convinced than most that the news matters much. A very good chartist trading the last forty years purely from the price data should in my view have done very well indeed, and might well have done considerably worse given access to the news. At best the timing of big economic news is hard to pinpoint, and at worst the continuous weaving together of the news and market price action is just a plausible stream of rationalization. My view is generally a pure technical assessment and that’s the case here as well. I shall leave you today with my personal favorite assessment of the power and prevalence of rationalizations from Jeff Goldblum’s character in the classic film The Big Chill. I haven’t worked out how to embed this on wordpress so unless Tim can help me with that (hint), then here is the link to that video on YouTube.
A draft I thought I had deleted went up as the second in this series of posts last night and if you want to see the formatted version with links and charts you can see that here.
