
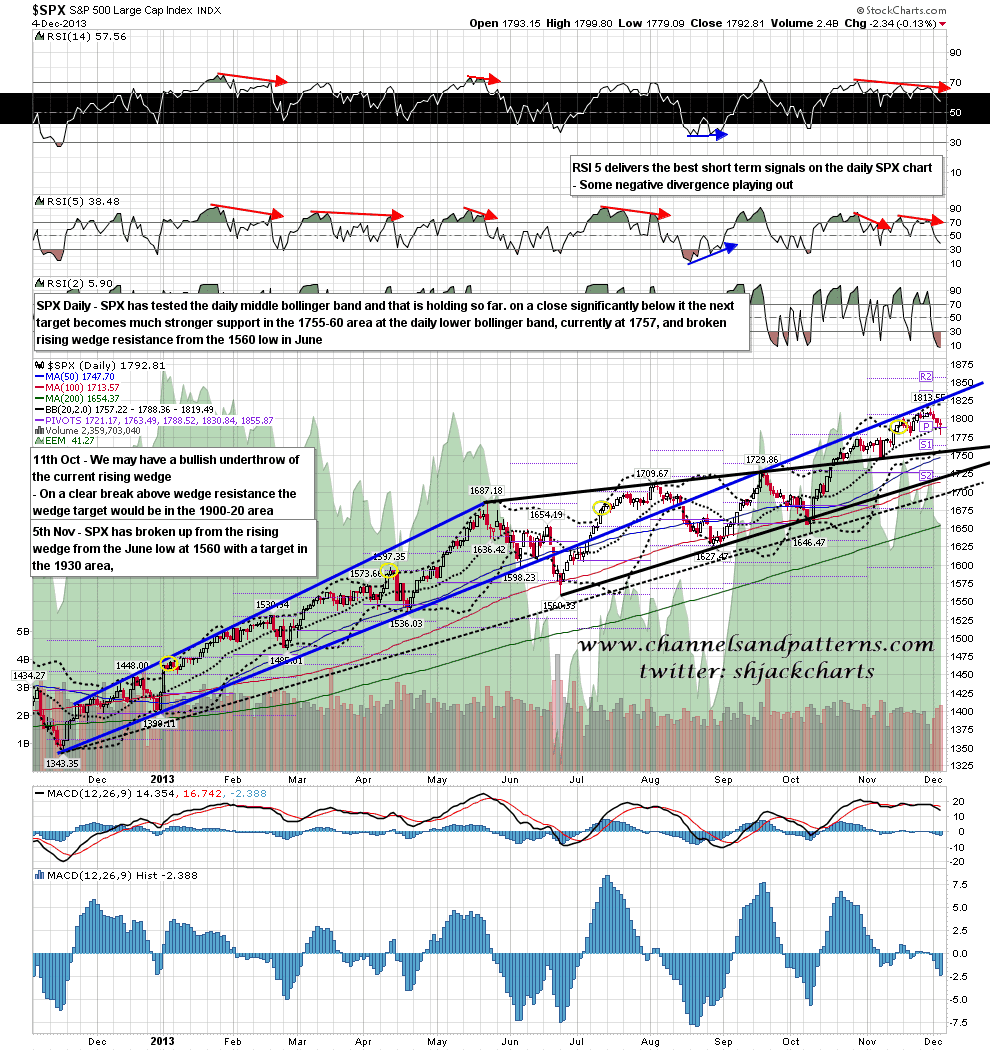
SPX tested the daily middle bollinger band hard yesterday but closed above it. My main target support level is at the daily lower bollinger band and to make that is going to require a close below the middle bollinger band, ideally this week but possibly as late as next Monday. Meanwhile this area is an important inflection point and I have both bull and bear scenarios in play here. SPX daily chart:
The bull scenario here is that the low yesterday completed a 50% fib retracement of the move up from 1746. On a sustained break over yesterday’s high at 1799.80 SPX a decent falling megaphone would break up with a target back at the highs, and a larger W bottom would break up with a target in the 1820 area, very close to the daily upper bollinger band at 1819.5. This isn’t my preferred scenario but it is very much in play and a sustained break back over 1800 should be respected. SPX 15min chart:
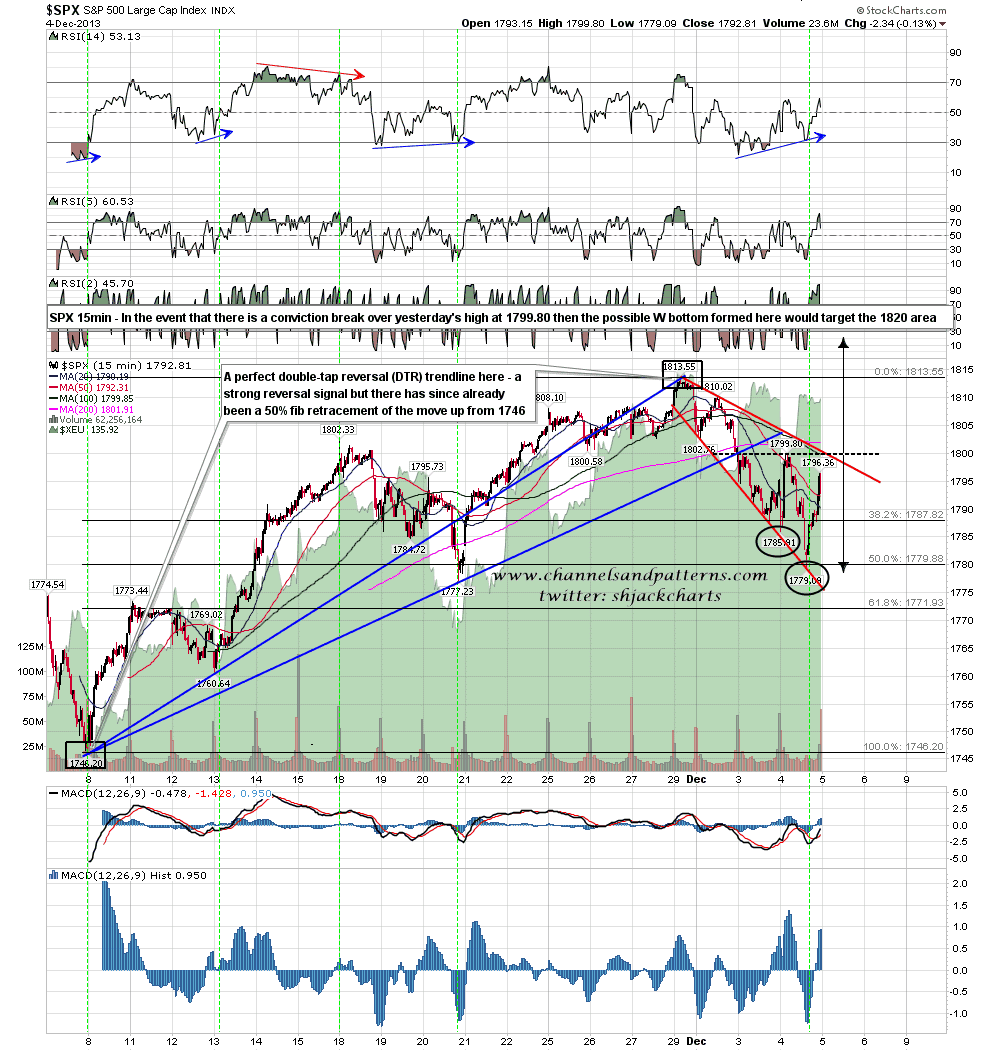
As an aside there is another very nice example of a double-tap reversal (DTR) trendline on the chart above In an uptrend this is a line from the start through the first significant retracement low to a perfect retest at the end of the trend. I’m still working up the stats on this new pattern/setup but results so far are very encouraging and as and when I get round to writing the book on trendlines that I’m planning I’m going to introducing this there as a new trendline setup.
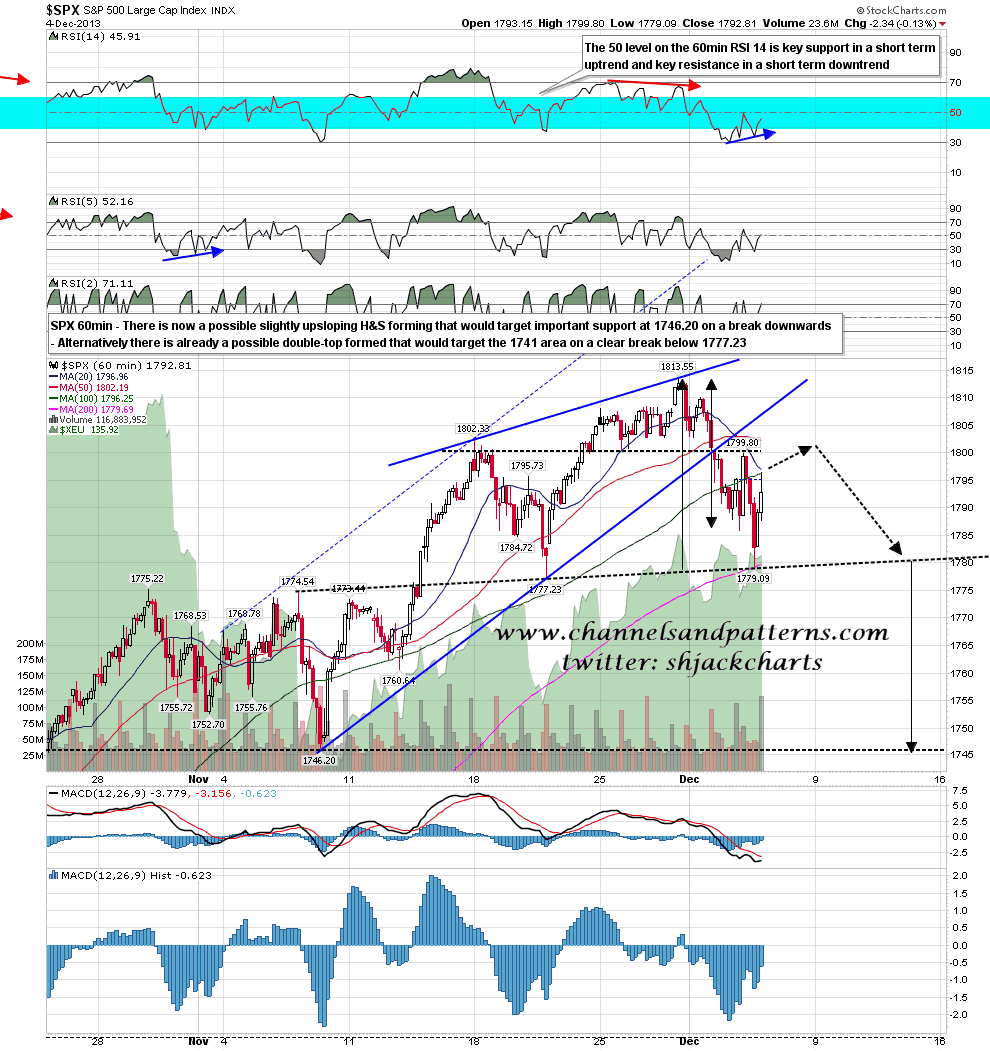
The bear scenario here is that either an M top has formed but not yet broken down or that the right shoulder of a slightly upsloping H&S is forming. The ideal right shoulder high would be in the 1802 area and if this is forming the right shoulder could take the rest of the week to form. SPX 60min chart:
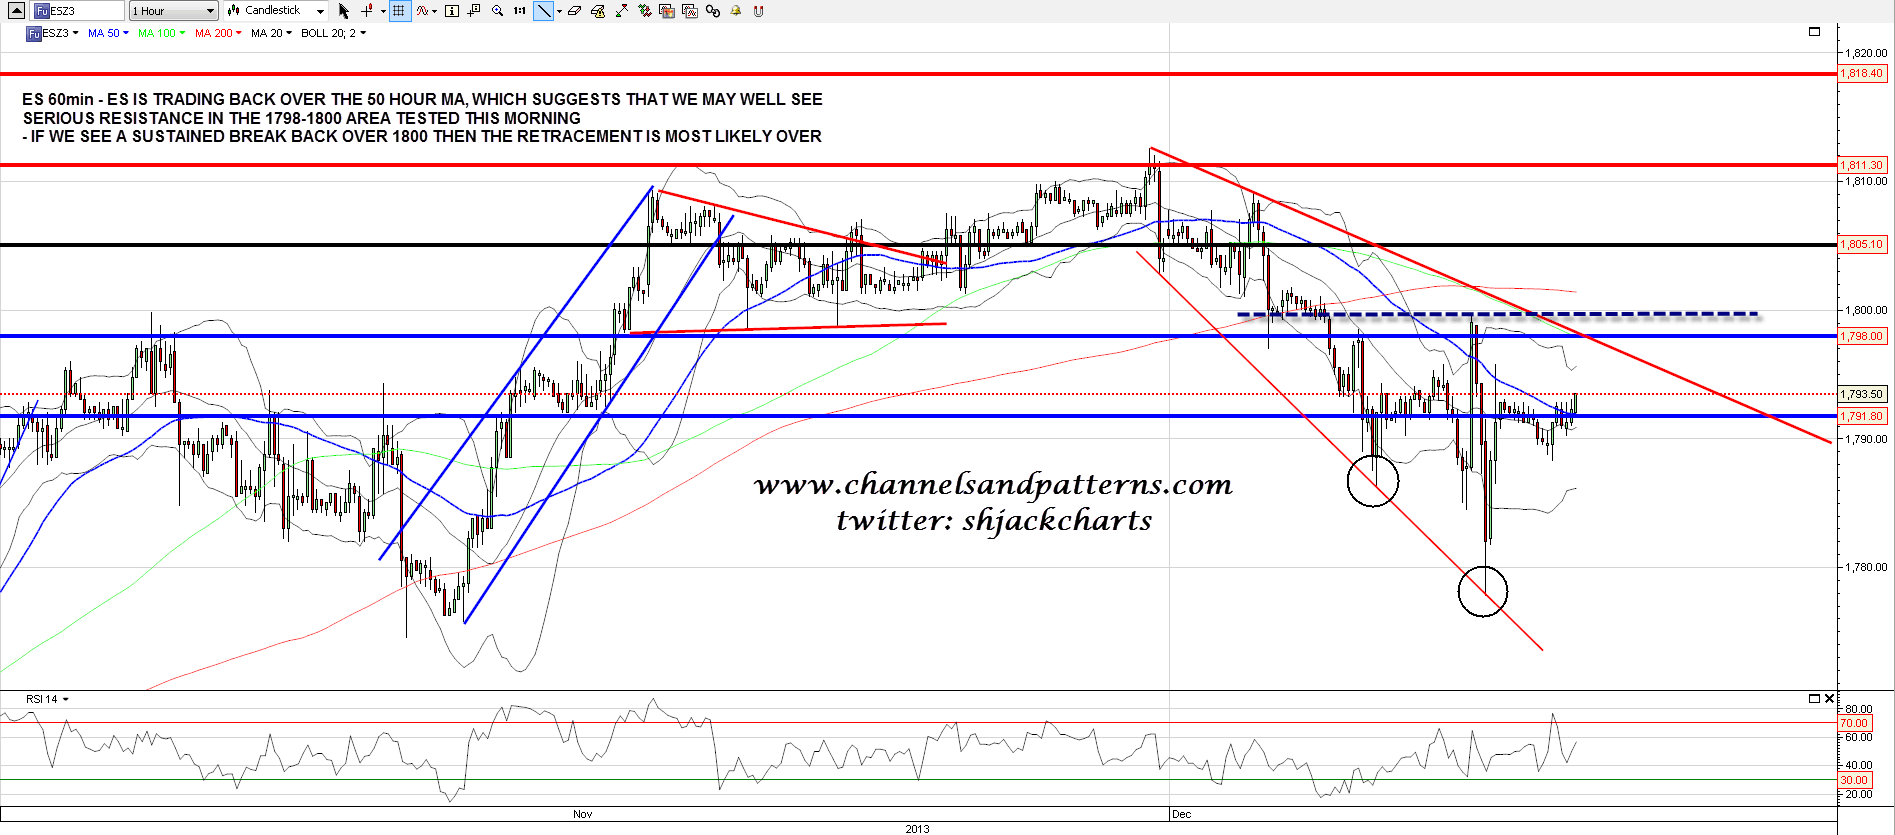
Looking at the ES 60min chart we are currently seeing a fight around the key 1792 area, with the weekly S2 pivot at 1791.8, and the 50 hour MA now at 1792. Bears ideally would like to keep ES under this level, though on a break above there is still key resistance in the 1798-1800 area and we may well see that tested today to test declining resistance from the high on both ES and SPX. ES 60min chart:
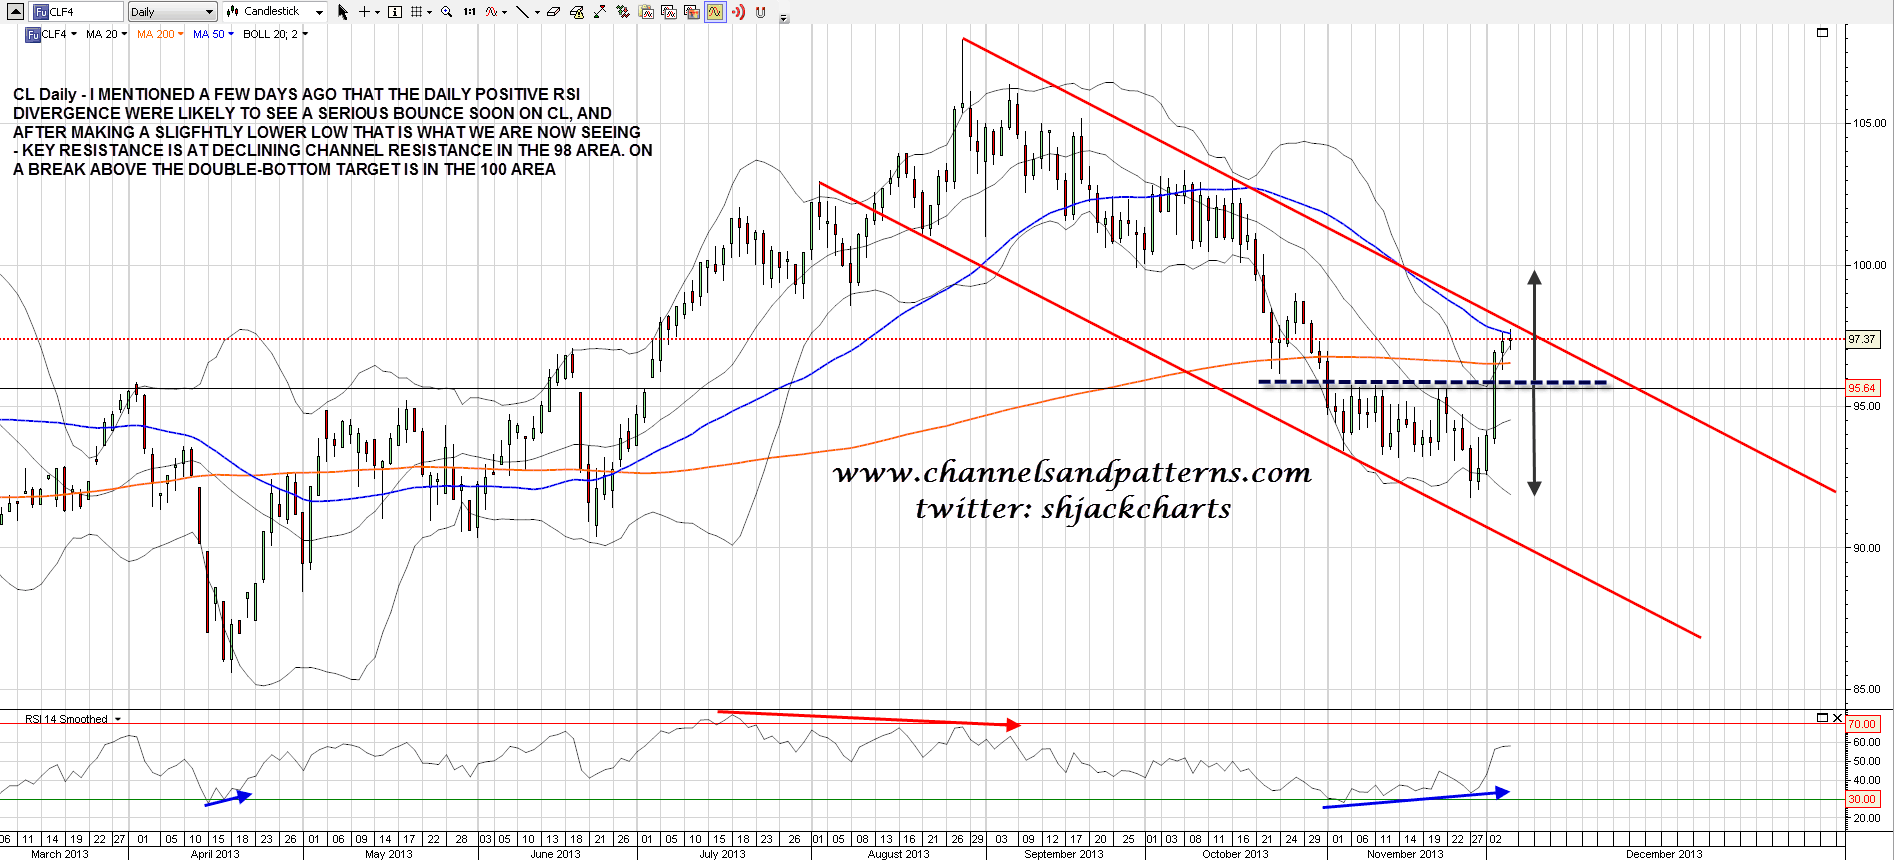
I’m behind looking at other markets and will try to post USD, bonds and gold charts tomorrow. For today CL has bounced hard as I suggested that it might well after seeing positive RSI divergence develop on the daily chart a couple of weeks ago and CL is now close to falling channel resistance in the 98 area. On a clear break above 98 the double-bottom target is at 100. CL daily chart:
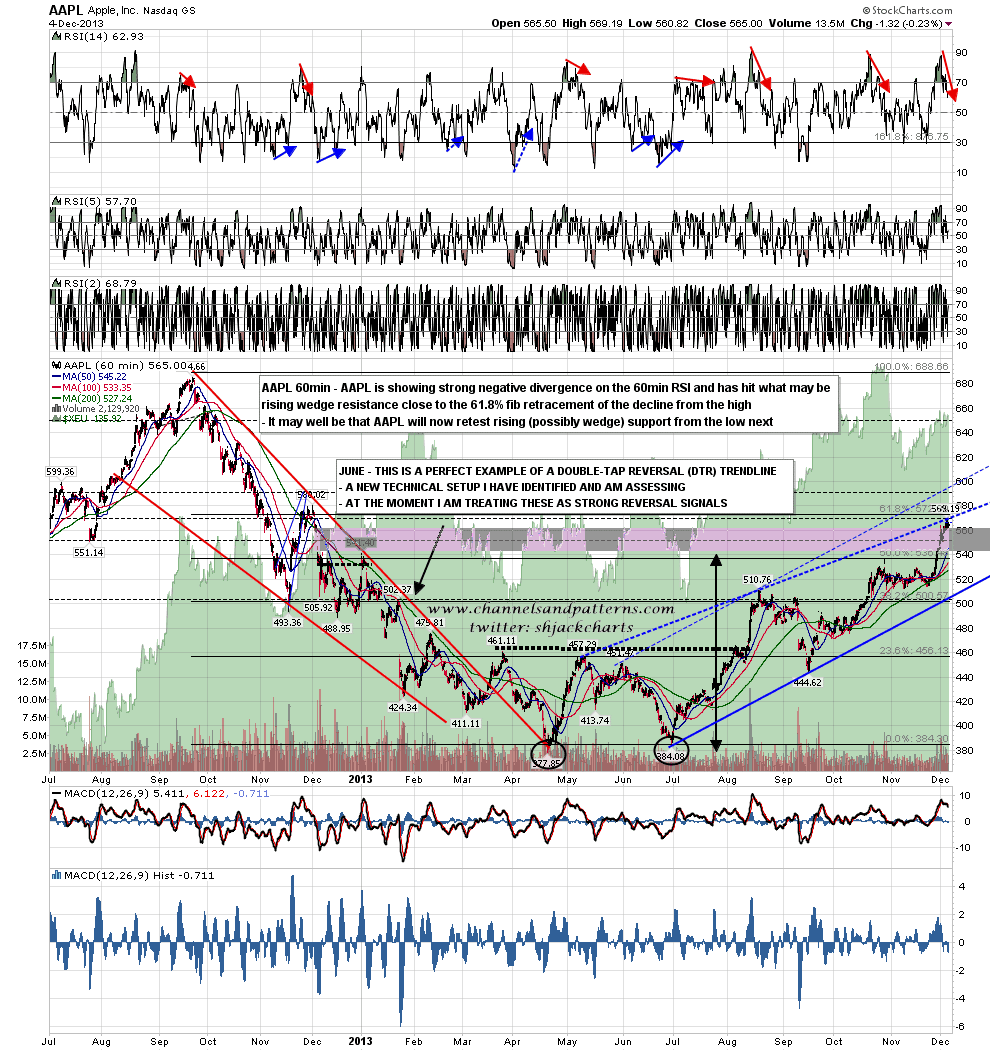
I haven’t posted an AAPL chart in a couple of weeks, mainly because my double-bottom target at 540 was made and I no longer have any major targets in play on AAPL. I do have it however in either a rising wedge or a rising channel from the low, and we should see shortly which one is correct. If we see a conviction break over possible rising wedge resistance then I have possible channel resistance in the 600 area. If we see a reversal at rising wedge resistance then the next obvious target would be a test of rising wedge support, now in the 505-10 area. If we see an overthrow of rising wedge resistance before a strong reversal then that would strongly suggest that the rising wedge will break down at the next test of wedge support. Regardless of what happens here there is strongly negative 60min RSI divergence here and a significant reversal back down in the near future is likely. AAPL 60min chart:
I’m leaning towards seeing more downside on SPX, but there is a decent bull scenario here as well,
