
I have been out all morning and only have time for two charts today. The NFP figures this morning were a decent beat and the US unemployment rate is now back down to 7%. Even though the Fed is clearly very gun-shy about tapering they may well feel that if they still don’t taper now then they will lose a lot of their remaining credibility.
Will tapering actually matter much? In perception terms perhaps, but if QE is reduced by a few billion per month one has to wonder how much practical difference that would make. There is still likely to be a lot of QE coming into markets for quite a while yet regardless.
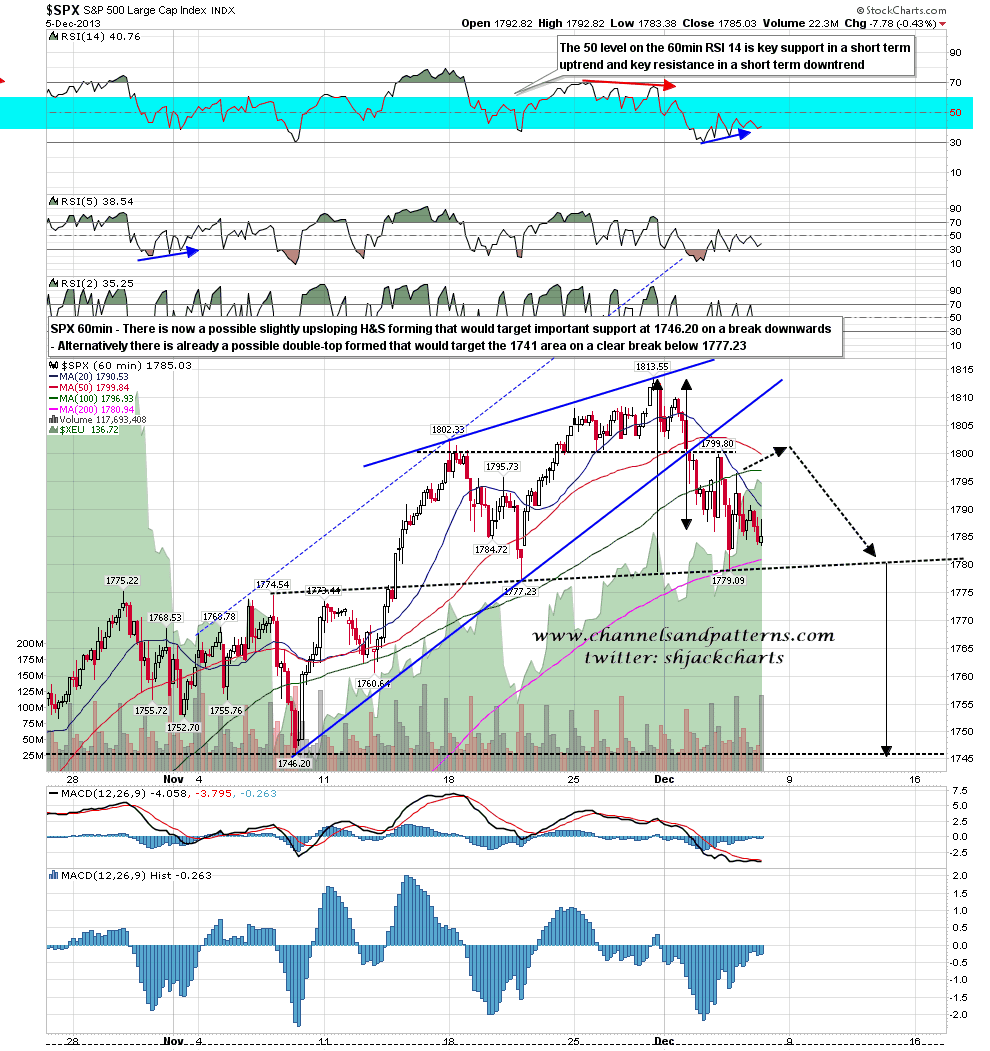
For today the bull and bear scenarios that I put forward yesterday are still both in play. On the bear scenario a slightly upsloping H&S is forming and the ideal right shoulder high would be in the 1802.5 SPX area today. On a move over 1805 this scenario would become steadily less likely. SPX 60min chart:
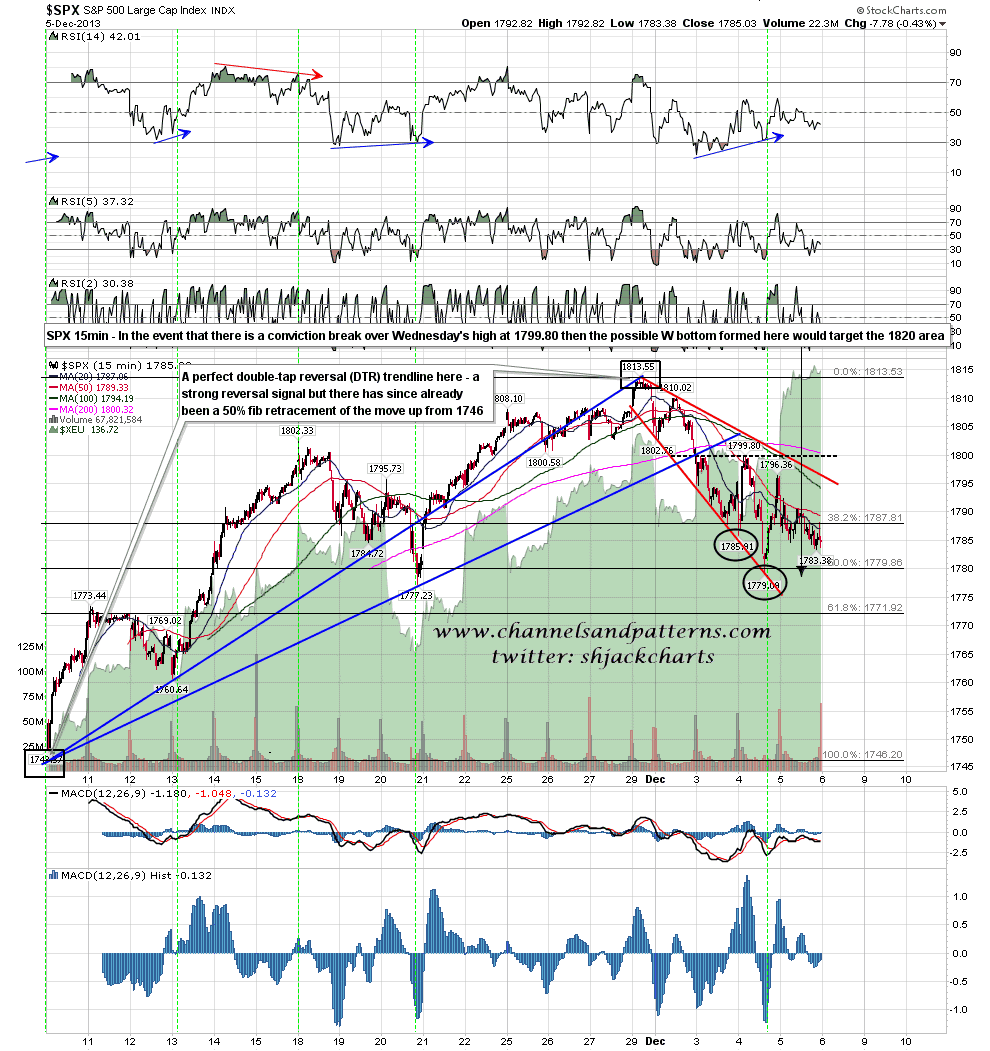
The bull scenario is that a sustained break over 1799.80 will trigger a double-bottom target in the 1820 area, and we may well see a gap up over 1799.80 at the open which would be suggestive of a gap and go trend up day setup. SPX 15min chart:
The bottom line here is that in order for the bearish scenario to look credible ES and SPX need to spend very little of the trading day today over 1800. If we see an opening gap above 1800 that will look bullish, and if SPX then holds over 1800 then the bear case for more retracement is most likely a write-off.
