
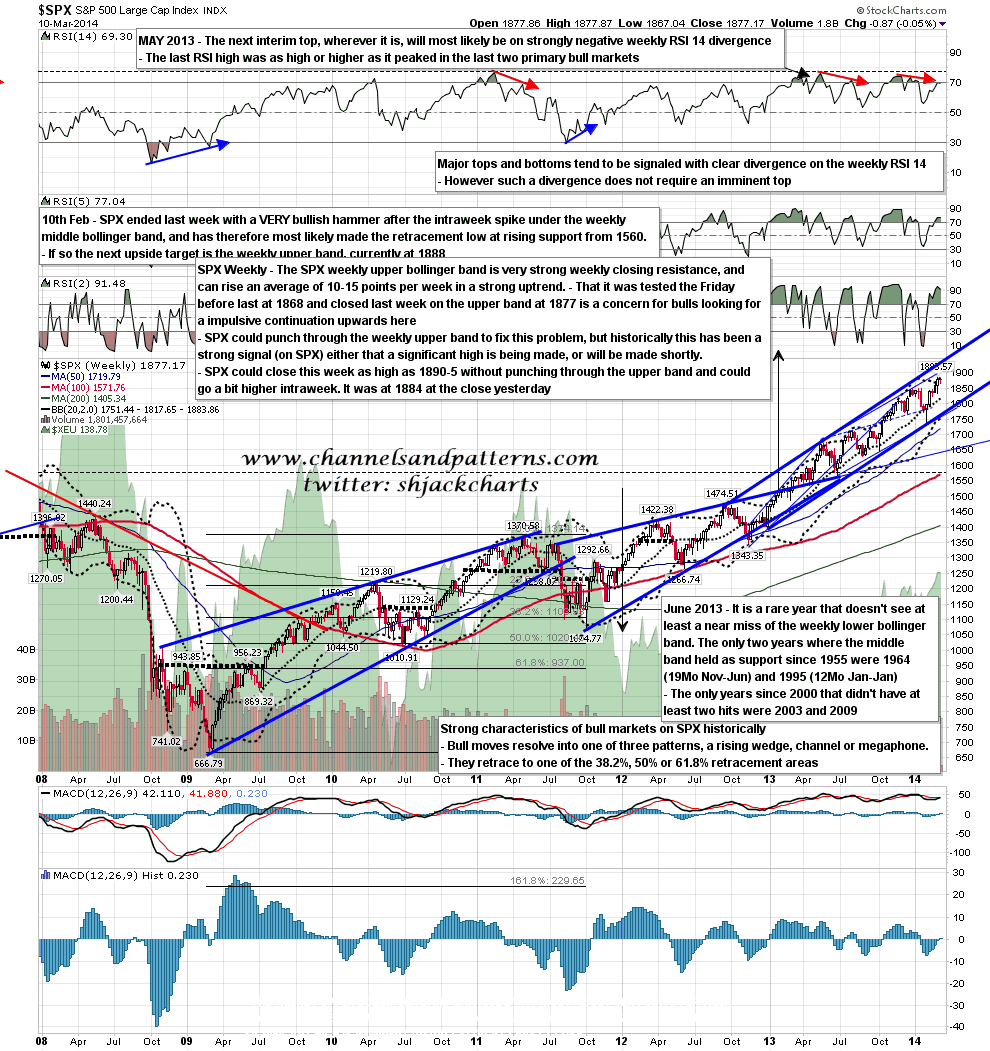
SPX is being compressed into an ever-narrowing trading band, and is likely to break out one way or the other soon. Above we have strong (weekly close) resistance at the weekly upper bollinger band, currently at 1884, and we could close this week as high as 1890-5 without a rare and bearish punch above it. I would add though that while a punch above would not necessarily be immediately bearish, but could mean, as it meant earlier this year, that SPX would make a significant high within 50 points or so. With any punch through likely to take SPX over 1900, that would still leave my rising wedge target at 1965 in range (more or less) before that next significant high was made. SPX weekly chart:
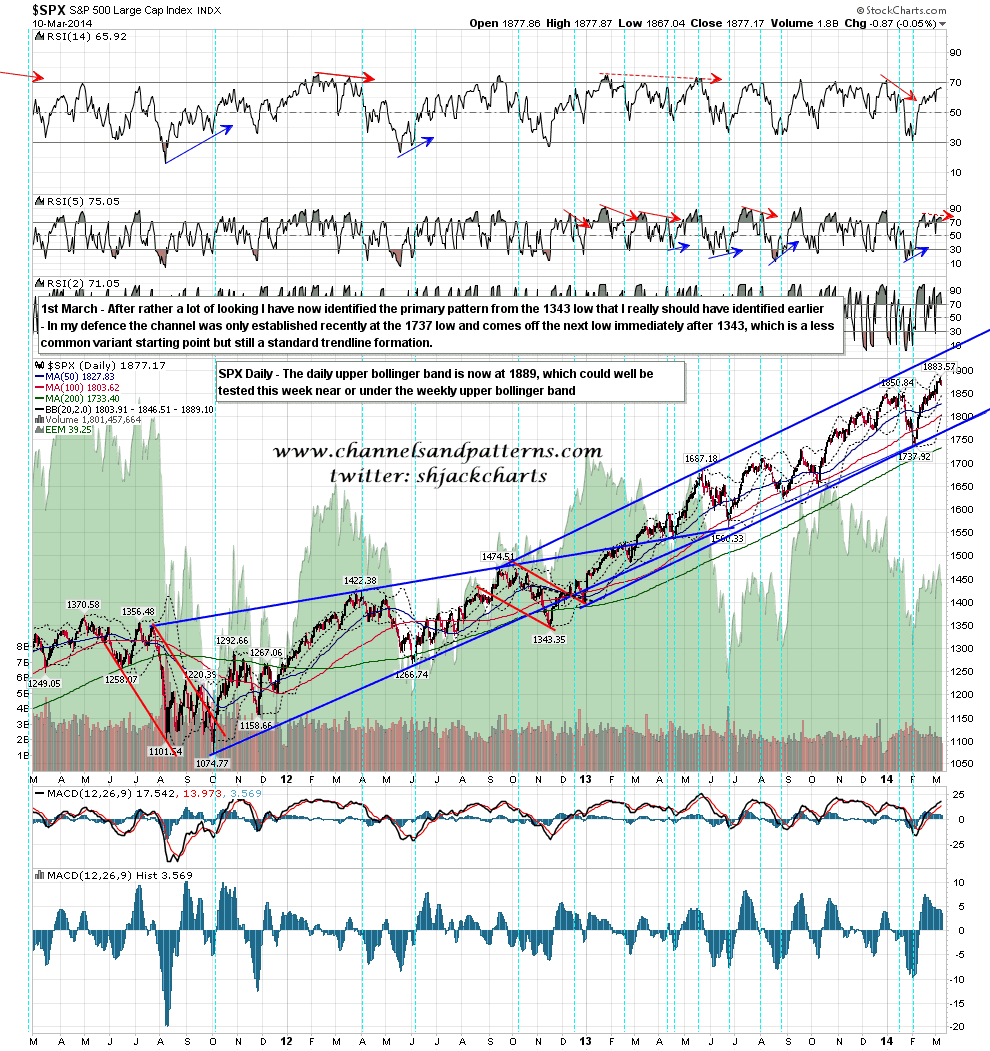
On the upside we also have the SPX daily upper bollinger band, which closed yesterday at 1889 and is most definitely in range this week as it is currently only five points above the weekly upper band. Whichever way this breaks that is a very attractive target that may well be hit shortly. SPX daily chart:
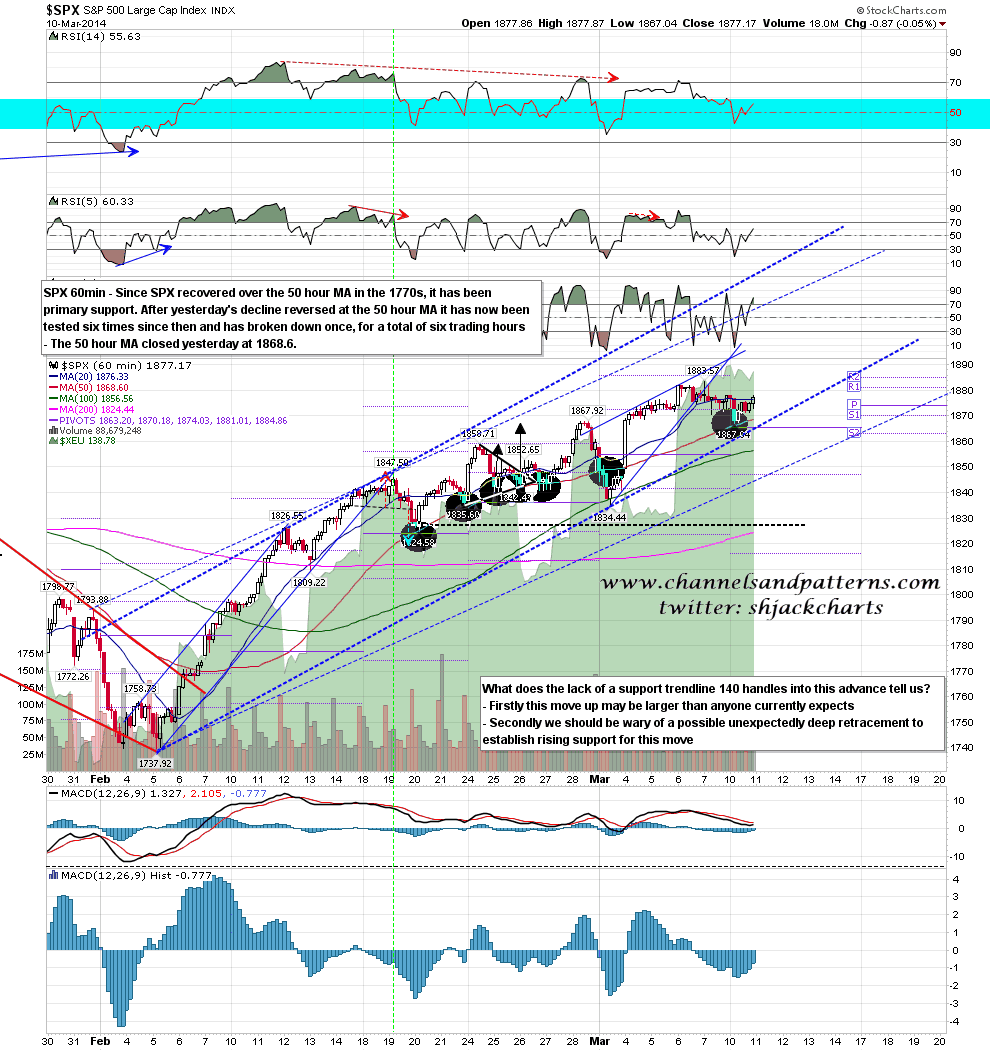
Below we have very strong support at the SPX 50 hour MA (50 HMA), which was the low yet again yesterday. After the 1738 low SPX recovered over the 50 HMA in the 1770s and since then it has been tested six times. Only one one of those tests did it break, for a total of only six trading hours before SPX recovered back over it. I said some weeks ago that the start of any meaningful retracement would be the break below the 50 HMA and apart from that one short-lived false alarm, we are still waiting to see that break. SPX 60min chart:
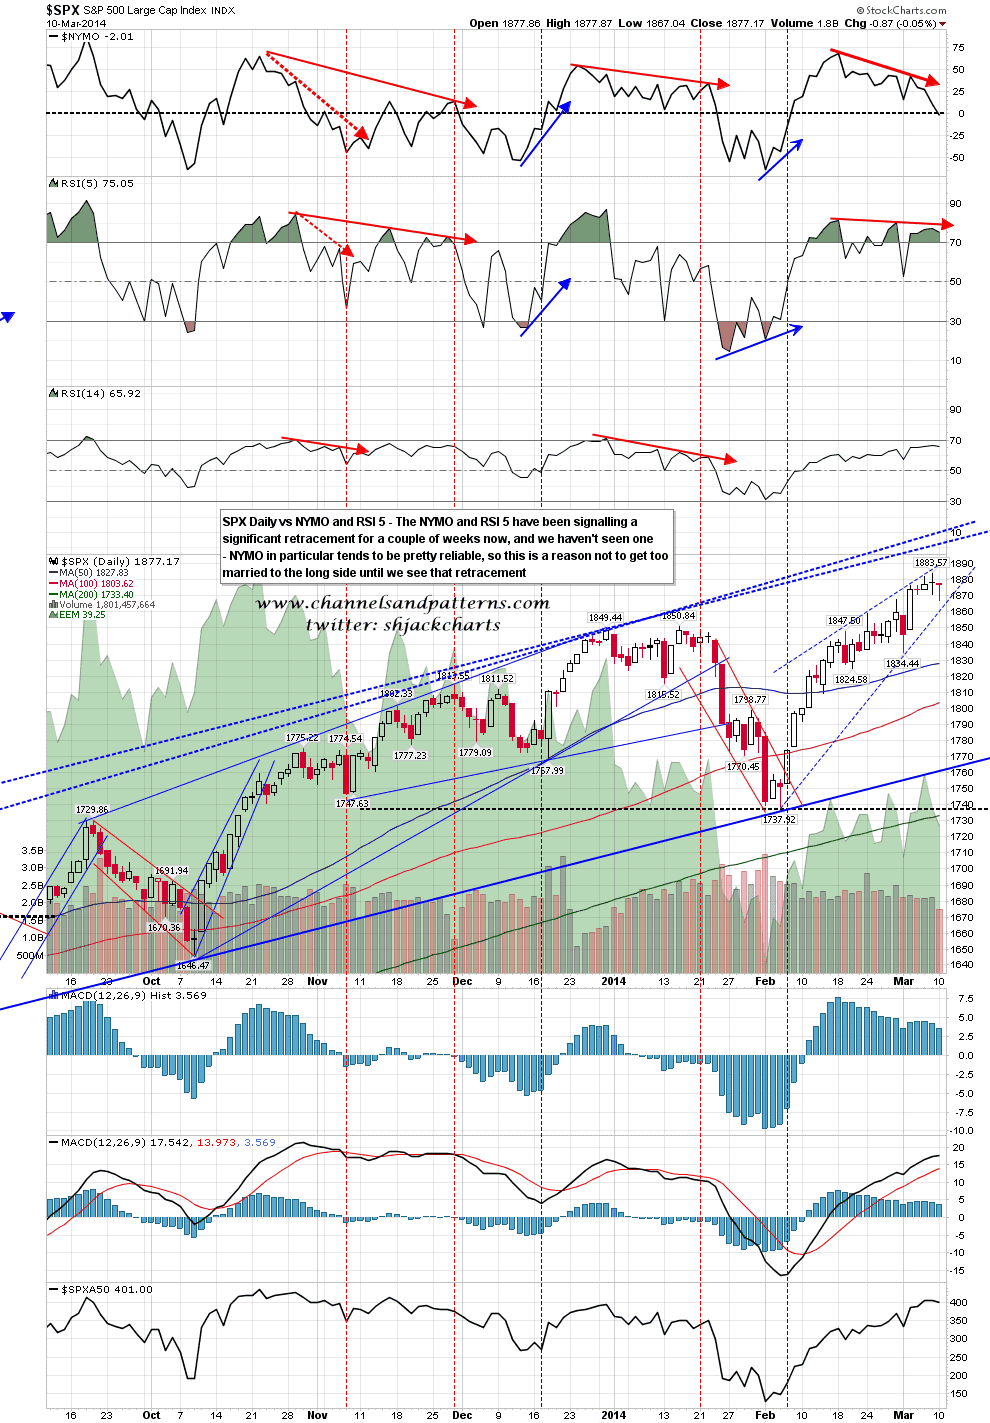
So which was is it likely to break? Well the longer this goes on, and the closer SPX comes to that 1965 target, then the higher the chances are that the break will be upwards. Until we see that break up however, the odds still favor retracement in my view, though less than they did. One key indicators that bears have on their side here is the very clear negative divergence between these new marginal highs on SPX, and both NYMO and the RSI 5 on the SPX daily chart. Both of these are good indicators, particularly NYMO, though there are always exceptions to every rule of course. SPX daily chart vs NYMO and RSI 5:
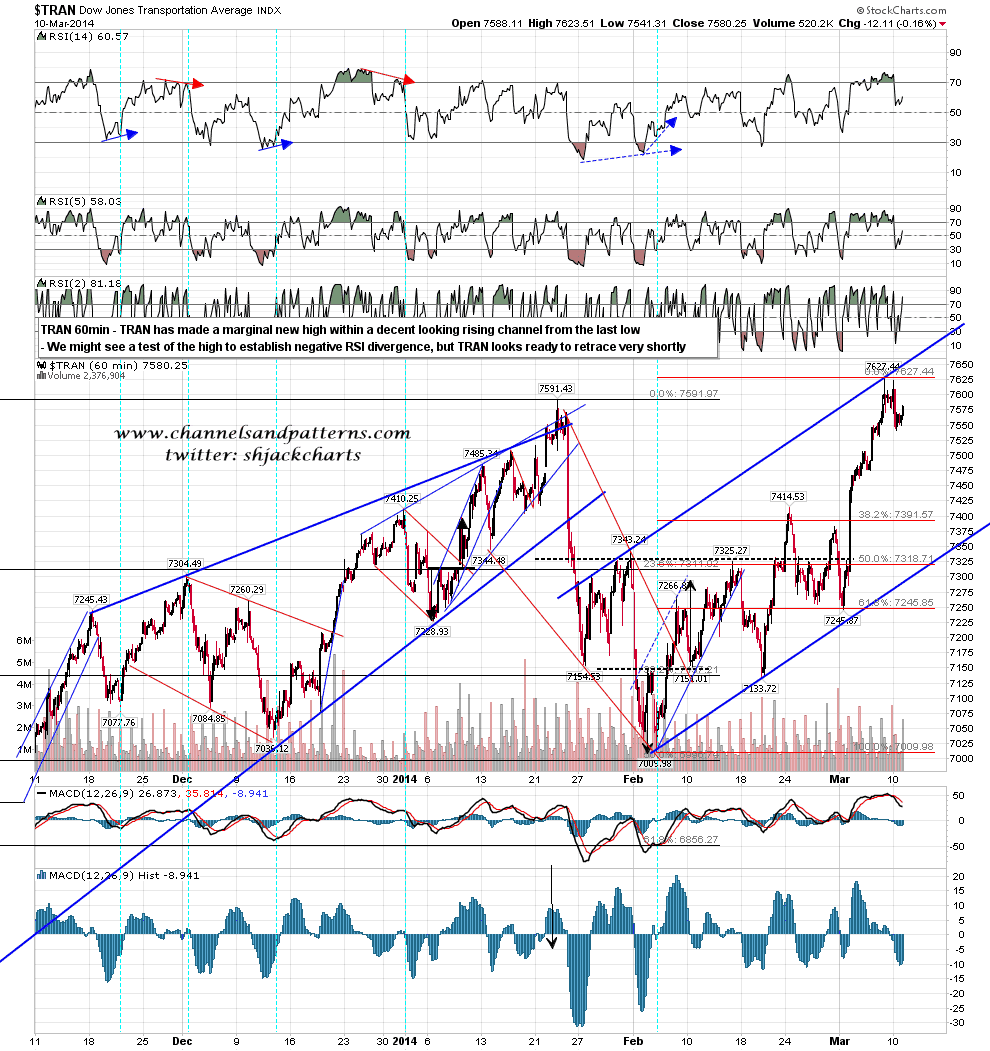
In addition I showed the bearish looking setup on TRAN yesterday morning and nothing has changed there this morning. As I said yesterday a retest of the highs would be routine enough before a breakdown and we may see that today. TRAN 60min chart:
For today I’m leaning cautiously long, looking for a test of the daily upper bollinger band. If we see a powerful move up through that, then we might see that move run away to the upside, in which case that should be respected in my view rather than treated as an immediate shorting signal. Until we see that however, I’ll be leaning short on any test of the daily upper band.
