
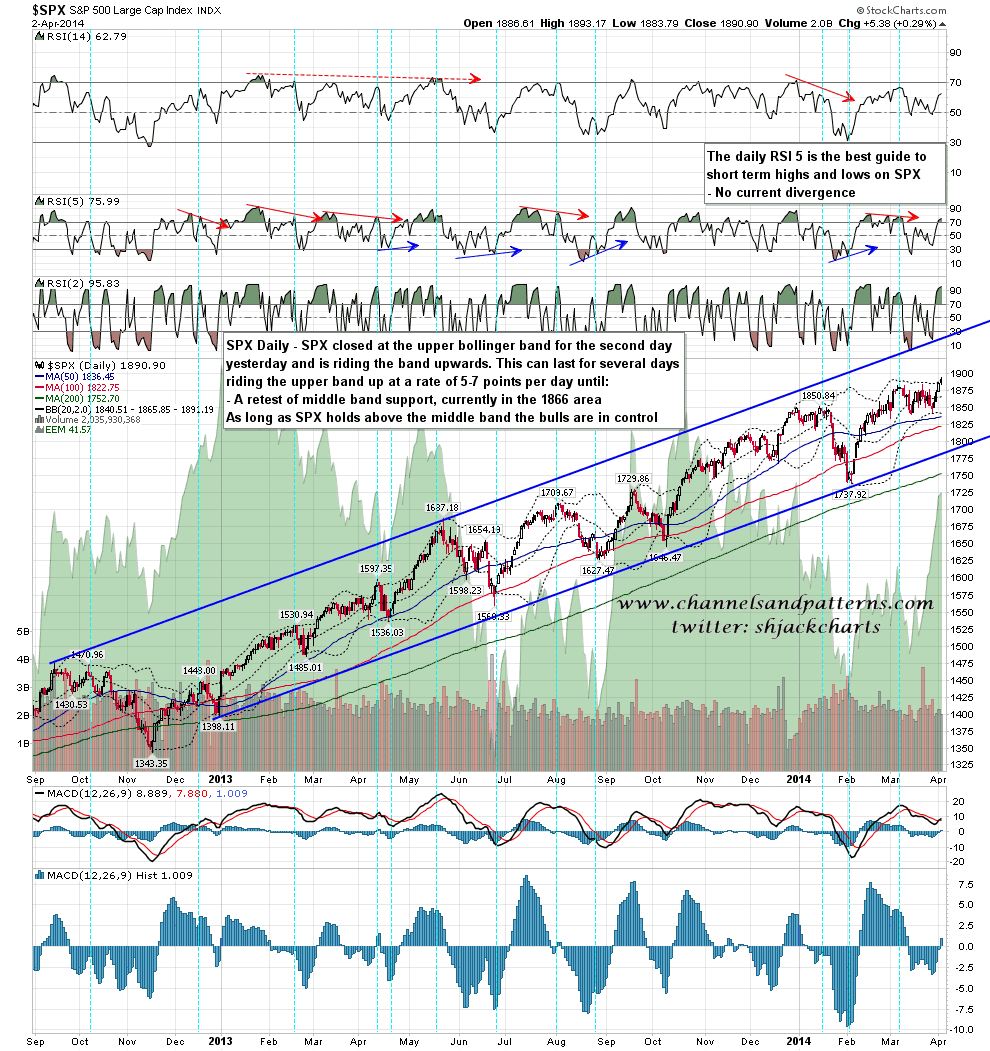
Yesterday morning I gave two options for the day and the first was that the SPX ride the daily upper band upwards. SPX closed a quarter point under the upper band so that was the option taken, and an upper band ride can last for several days, rising with the upper band at an average gain of 5 to 7 points per day. If we do the same again today then we should expect the close to be close to 1896/7 SPX. Strong support is at the middle band, currently at 1866. SPX daily chart:
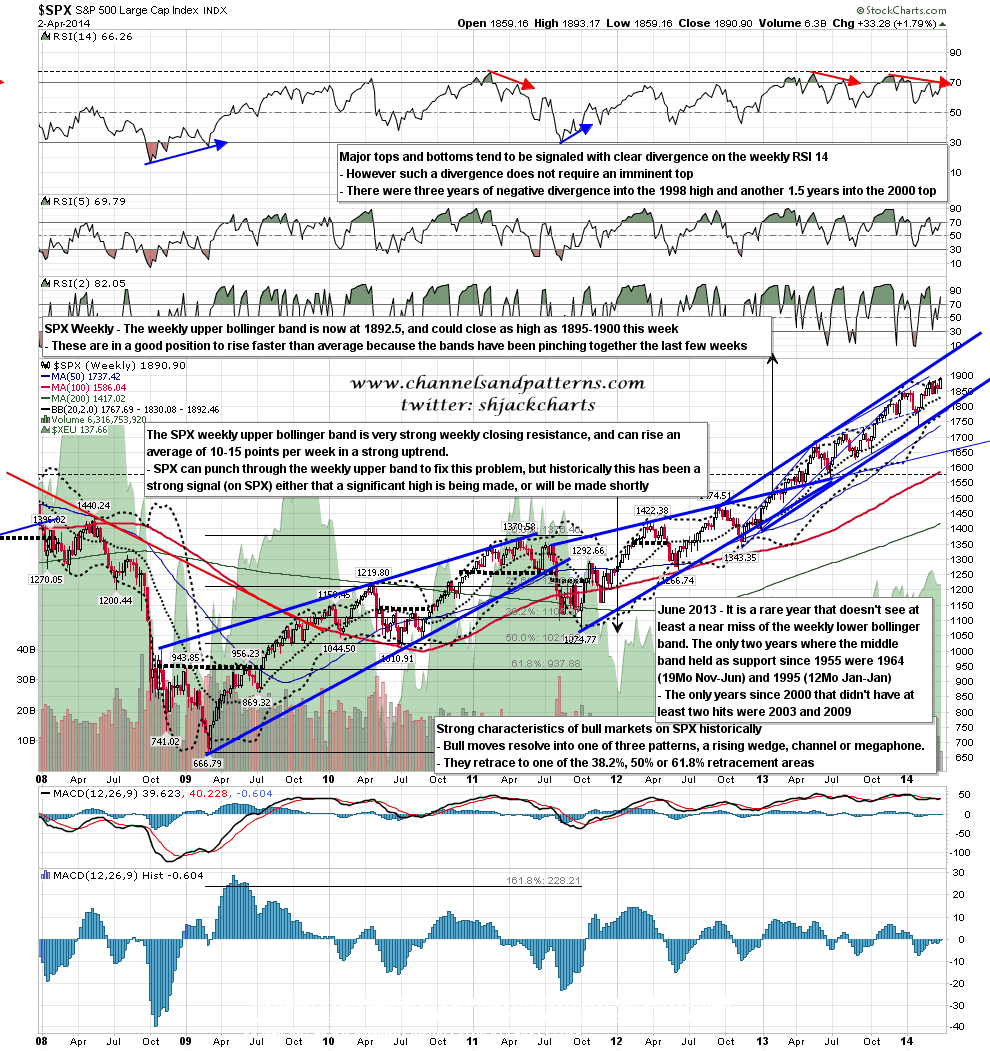
NFP tomorrow is a wild card for any upper band ride of course, and there is strong resistance close above at the SPX weekly upper bollinger band. I am expecting that to close the week in the 1895-1900 area if SPX stays strong, and I wouldn’t expect SPX to close more than five points above there. Next week the weekly upper band can rise another 10-15 points and I would in any case expect the daily upper band ride to finish by Wednesday or Thursday, so there is room here for a ride up lasting several days. SPX weekly chart:
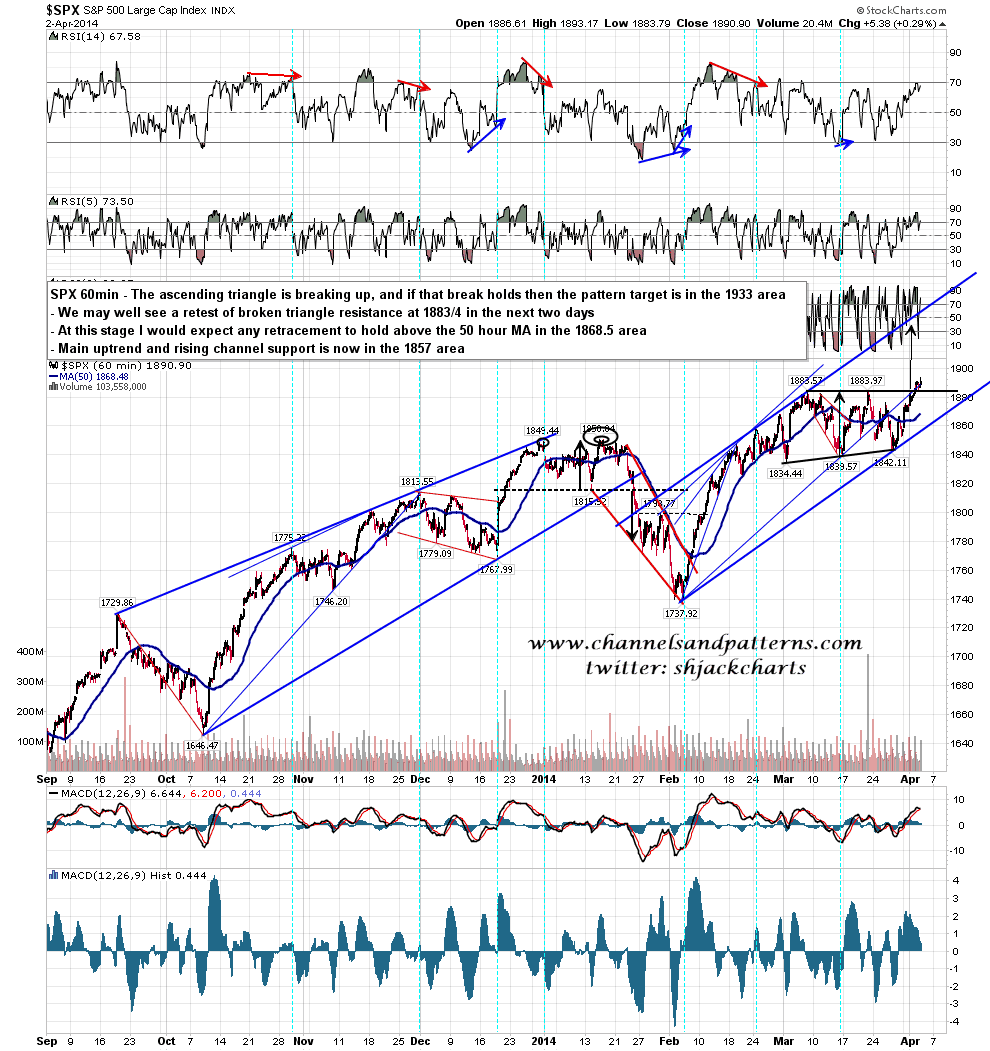
On the SPX 60min chart the ascending triangle has now clearly broken up with a target in the 1933 area. We may well see a retest of broken triangle resistance at 1883/4 today or tomorrow. If that doesn’t hold then there is strong support at the 50 hour MA at 1868.5, strengthened by support at the daily middle band just below. As long as that daily middle band holds as support the bulls are in control here. SPX 60min chart:
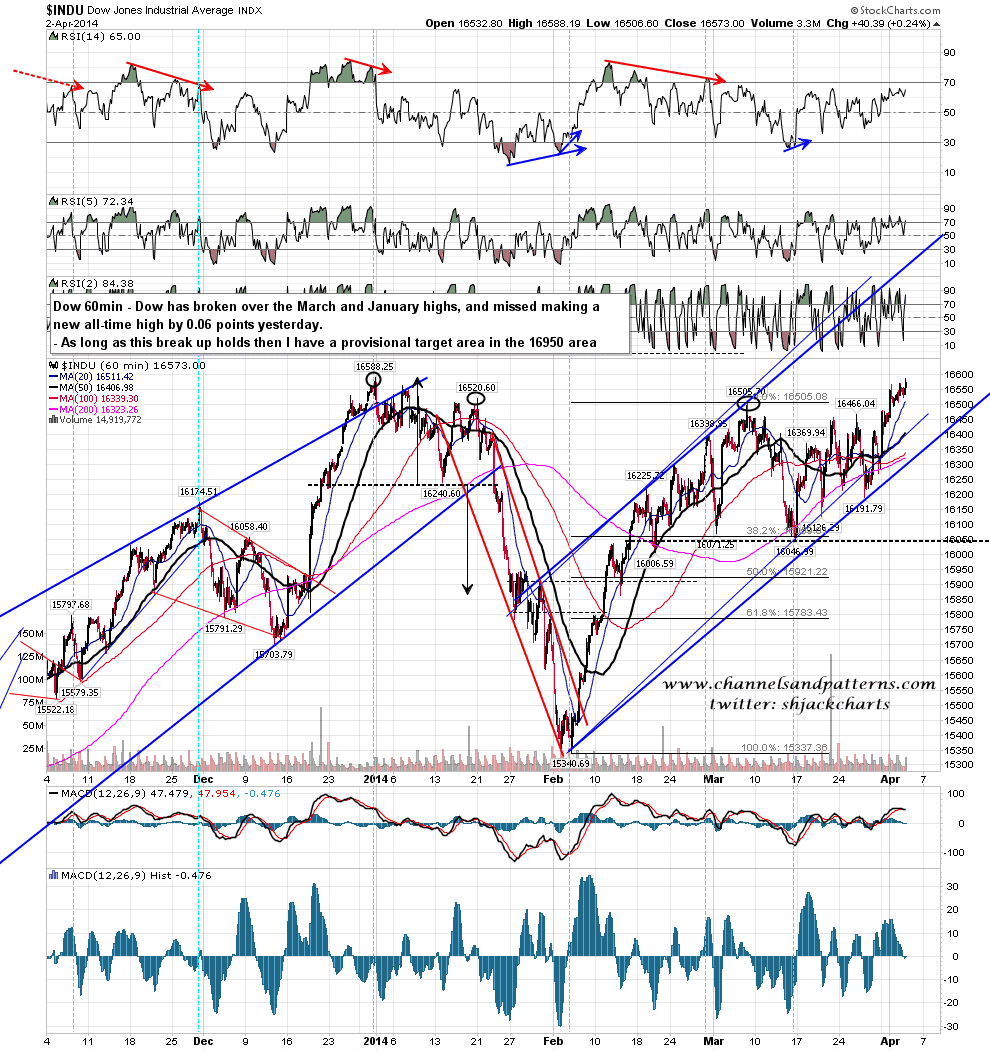
Dow tested the current all-time high yesterday, falling short of matching it by only 0.06 points. There is obviously still a large and perfectly formed double-top in play here on Dow and other indices, but they aren’t worth considering until we can see at least some significant signs of weakness. Something to bear in mind if we do see some unexpected weakness though. Dow 60min chart:
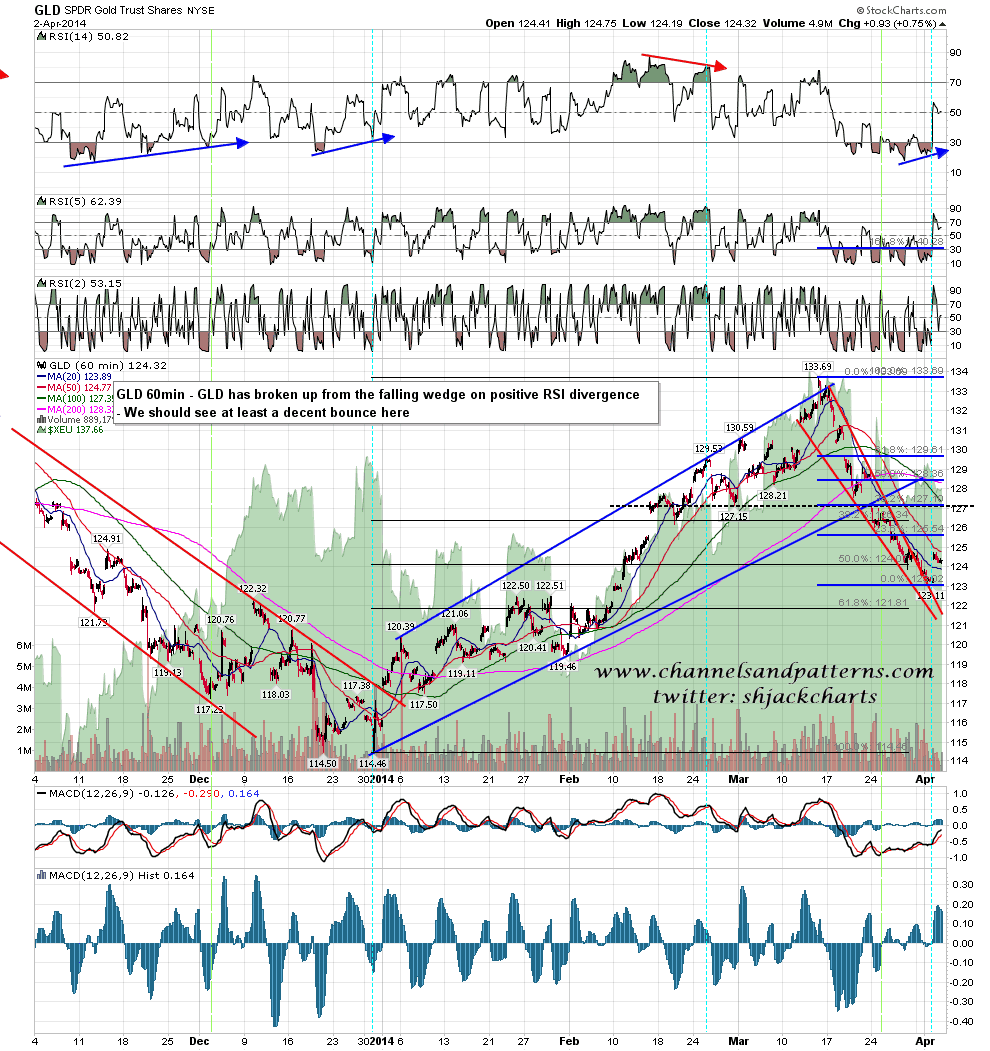
On other markets GLD has broken up from the falling wedge there on decent 60min RSI positive divergence. We might see a retest of the current retracement low but this should signal at least that a decent rally has either started or will be starting shortly. GLD 60min chart:
For today I am expecting that we will more than likely ride the SPX daily upper band for a third day, with a target close near the 1896/7 area. If we follow the normal bull schedule I’ll be looking for an AM, possibly as low as 1883/4 SPX, followed by a grind up for most of the rest of the day. If we are going to see weakness today then the support levels to watch on ES are 1876/7, 1871-3, 1867 and 1860/1.
