
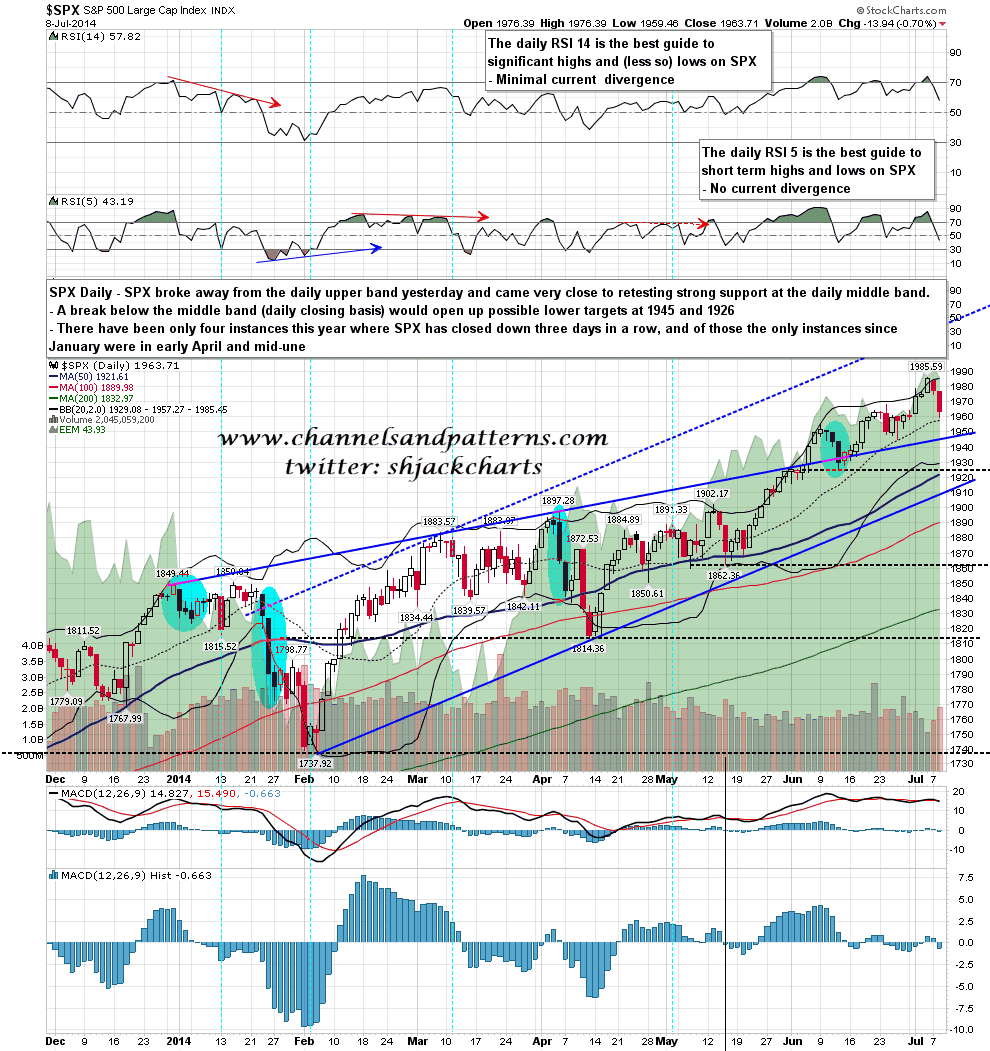
Bears put a strong day together yesterday and broke down below the 50 hour MA. Shortly before the low I tweeted a confluence of strong support levels in the 1957-60 range, and the low was at 1959.46. The key support level here is the SPX daily middle band at 1957, and only a closing break below that would open up lower targets at the daily lower band in the 1930 area and the 50 DMA at 1921. The last two significant lows were at 1945 and 1926 and both of those are potential H&S necklines of course. SPX daily chart:
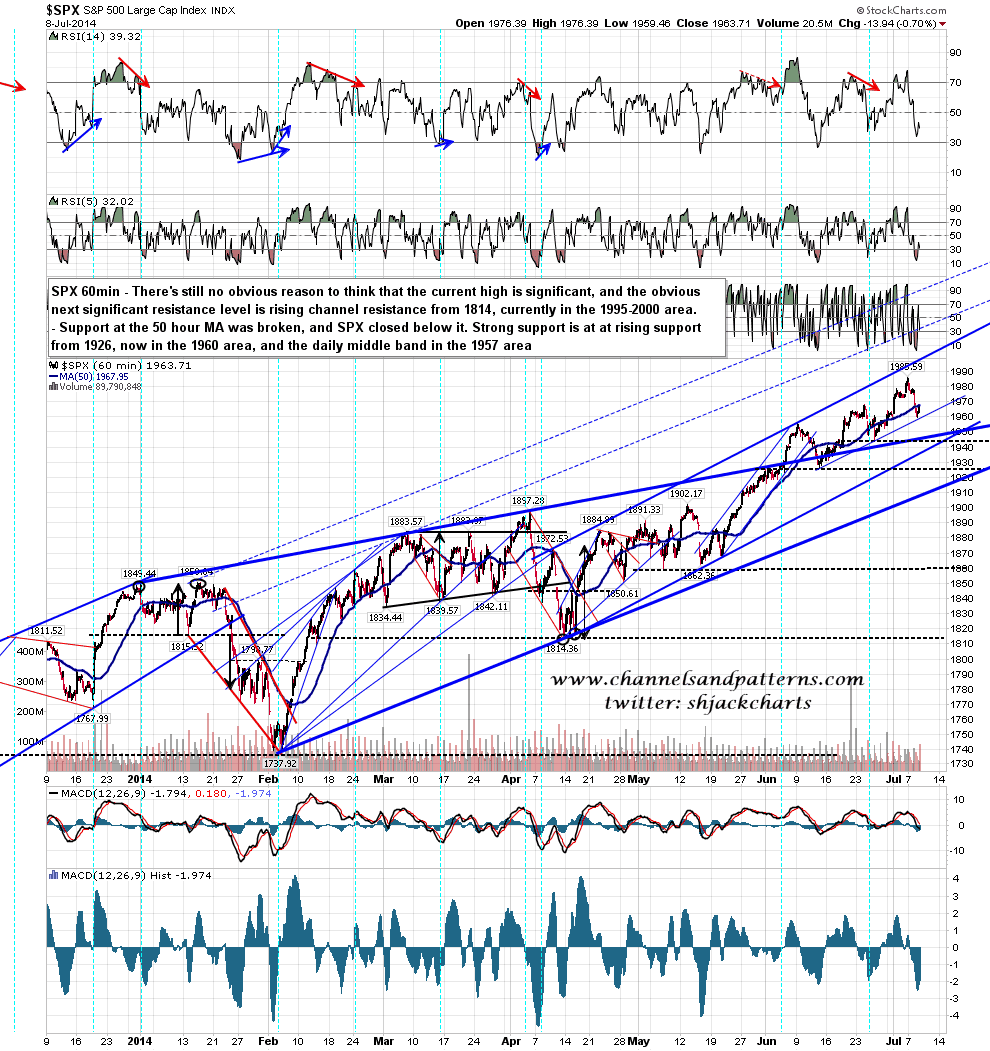
I’ve redrawn the resistance trendline on the rising wedge from 1737 as I think the revised trendline is better quality. That support is now in the 1948-50 area and if this wedge is really breaking upwards I’d be expecting that resistance should hold now. SPX 60min chart:
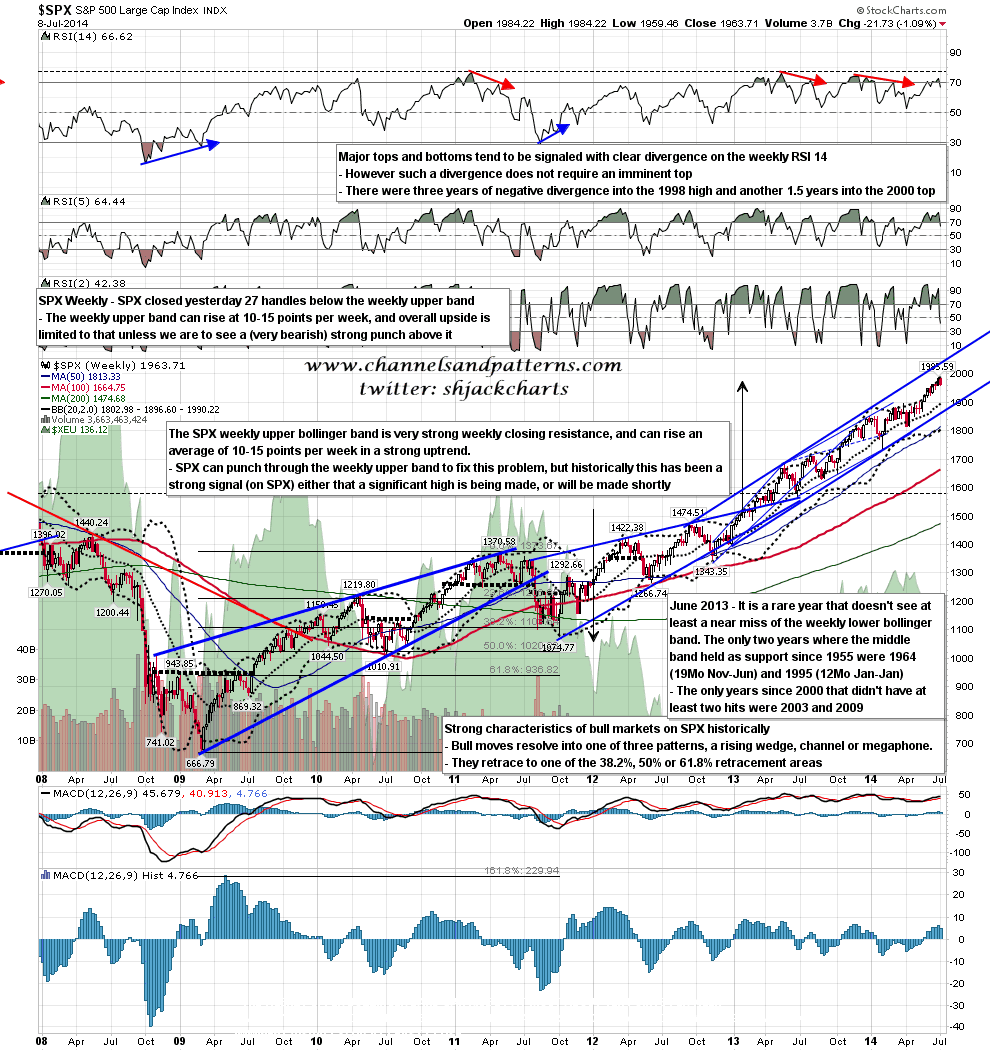
Does this decline so far this week weaken the overall bull case here? Not so far. I’ve mentioned quite a few times that the weekly upper band can only rise at 10-15 points per week, and that punches above it are both rare and significantly bearish. We should therefore expect a two-way market as we move towards upside targets, and while SPX remains between the daily middle and upper bands, there’s not yet any reason to think that this is anything else. A daily closing break below the daily middle band at 1957 would open up deeper targets, but until we see that there’s not yet much reason to be looking for a significant trend change here. SPX weekly chart:
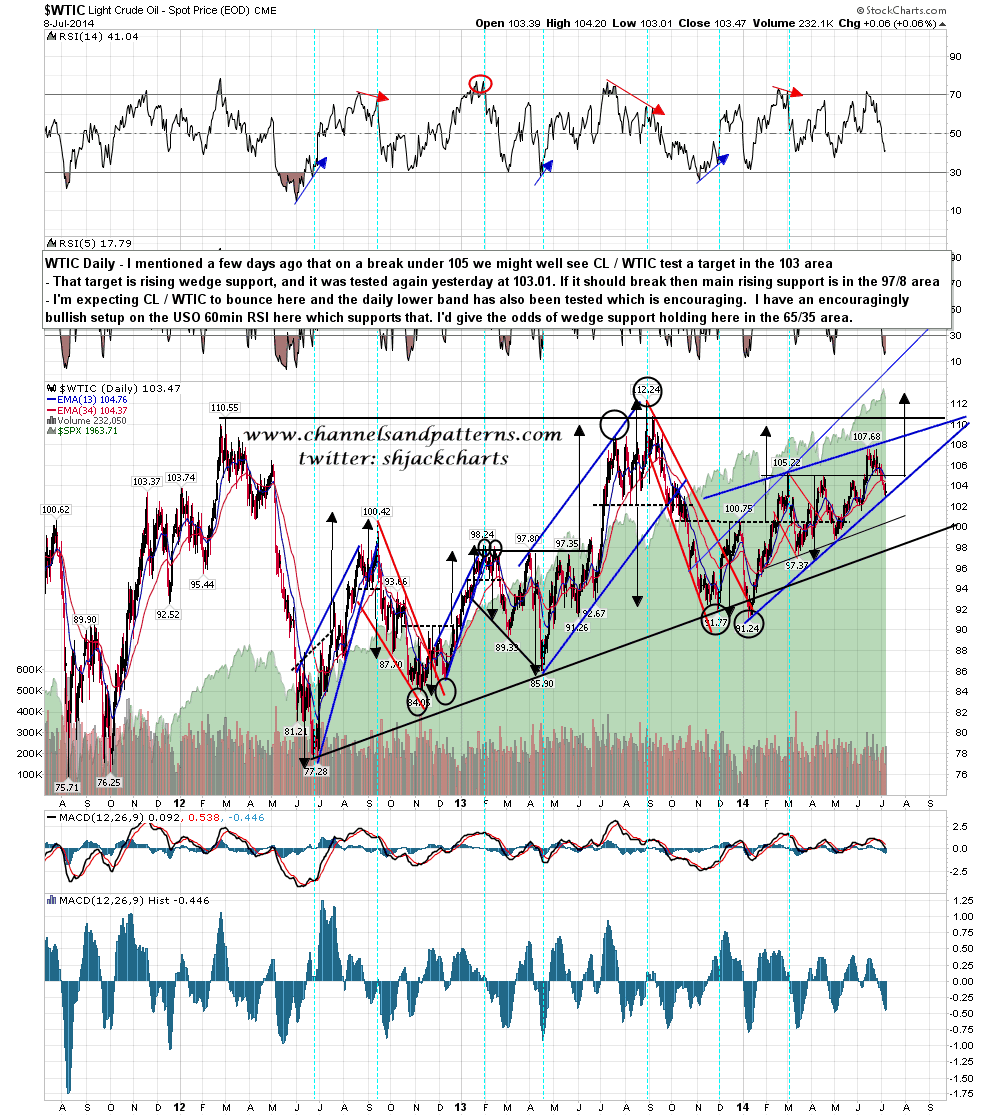
CL / WTIC tested rising wedge support again at 103.01, and oil bulls really need to hold that level to avoid opening up further downside targets through to 97/8. A break below 103 would be a serious warning signal. WTIC daily chart:
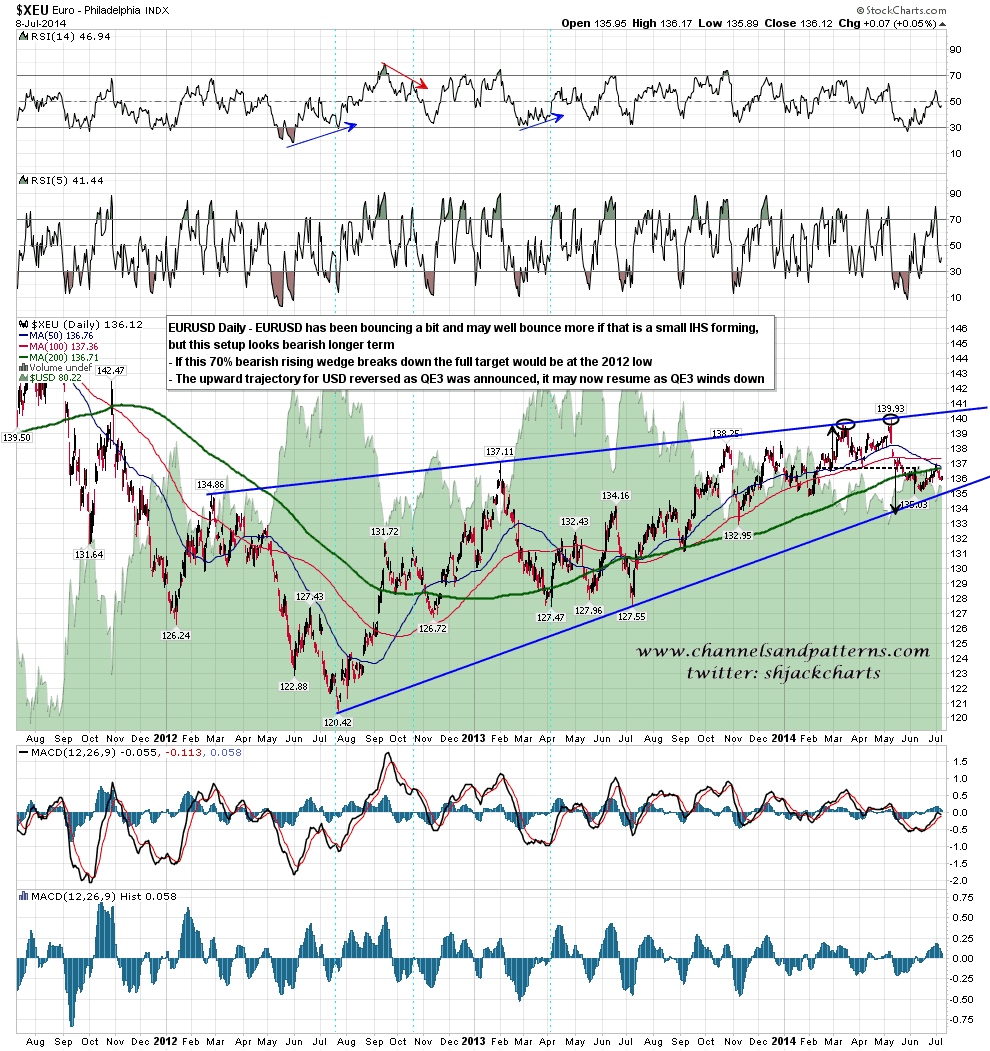
It’s a while since I have posted the EURUSD chart, and it is still bouncing gently. A small IHS has formed and if that breaks up the bounce may extend to the 138.5 area. The bigger picture remains bearish after this bounce. EURUSD daily chart:
I have declining resistance from the high in the 1970 SPX area, and that is an obvious target for the bounce from yesterday’s lows. A break above 1970 SPX would suggest that the decline is over, but until then a retest of yesterday’s lows is very much on the cards today. The odds don’t favor a red close today as there have been only four instances this year when SPX closed down for three consecutive days, and only two instances since January.
