
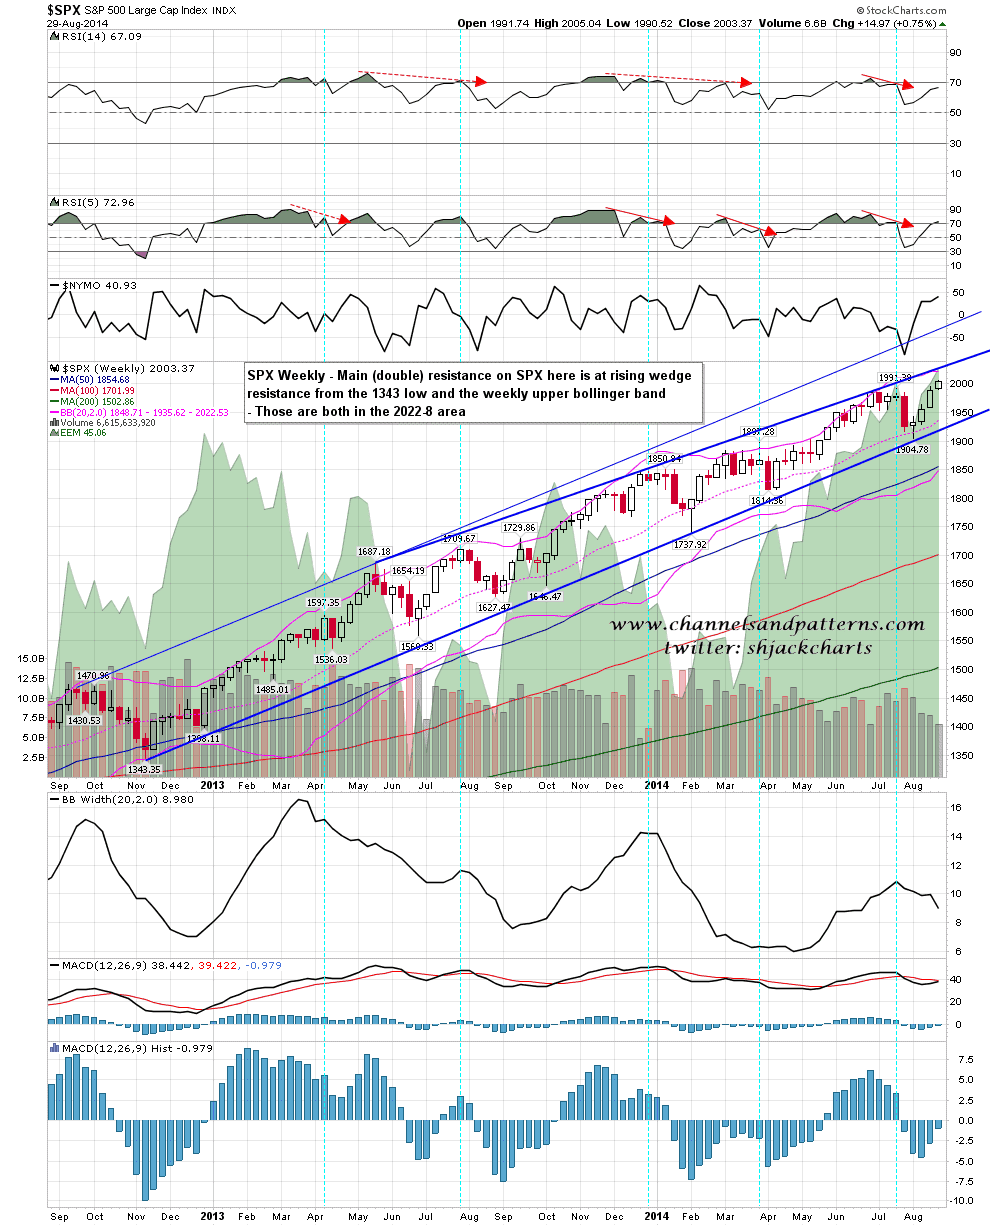
ES made a new all time high overnight, and SPX is getting close to testing the very strong resistance zone above. That has moved up a bit since I was looking at that a few days ago, and on the weekly chart that is now in the 2022-8 zone, with the weekly upper band in the 2022/3 area and rising wedge resistance from the 1343 low now in the 2026-8 area. SPX weekly chart:
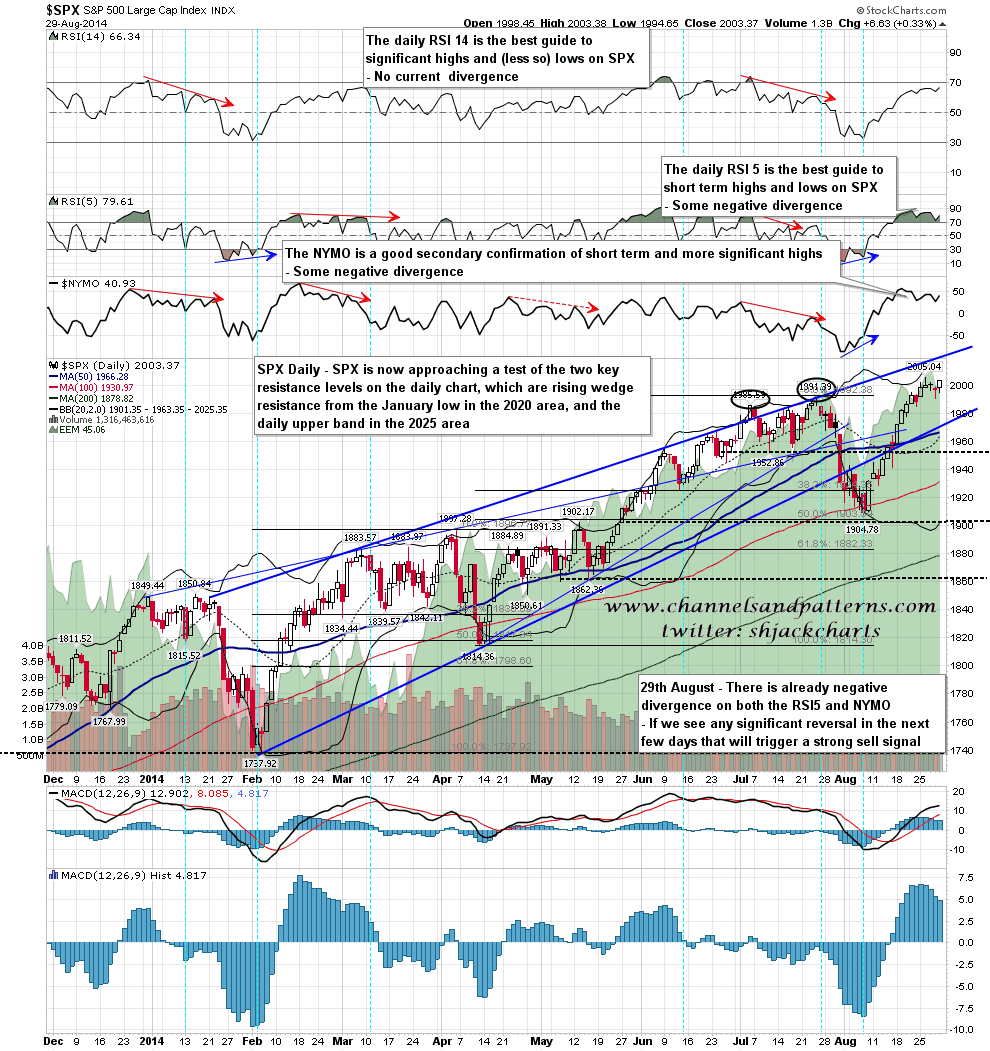
On the daily chart resistance is at rising wedge resistance from the January low, now in the 2020 area, and the weekly upper band, now in the 2022 area. SPX daily chart:
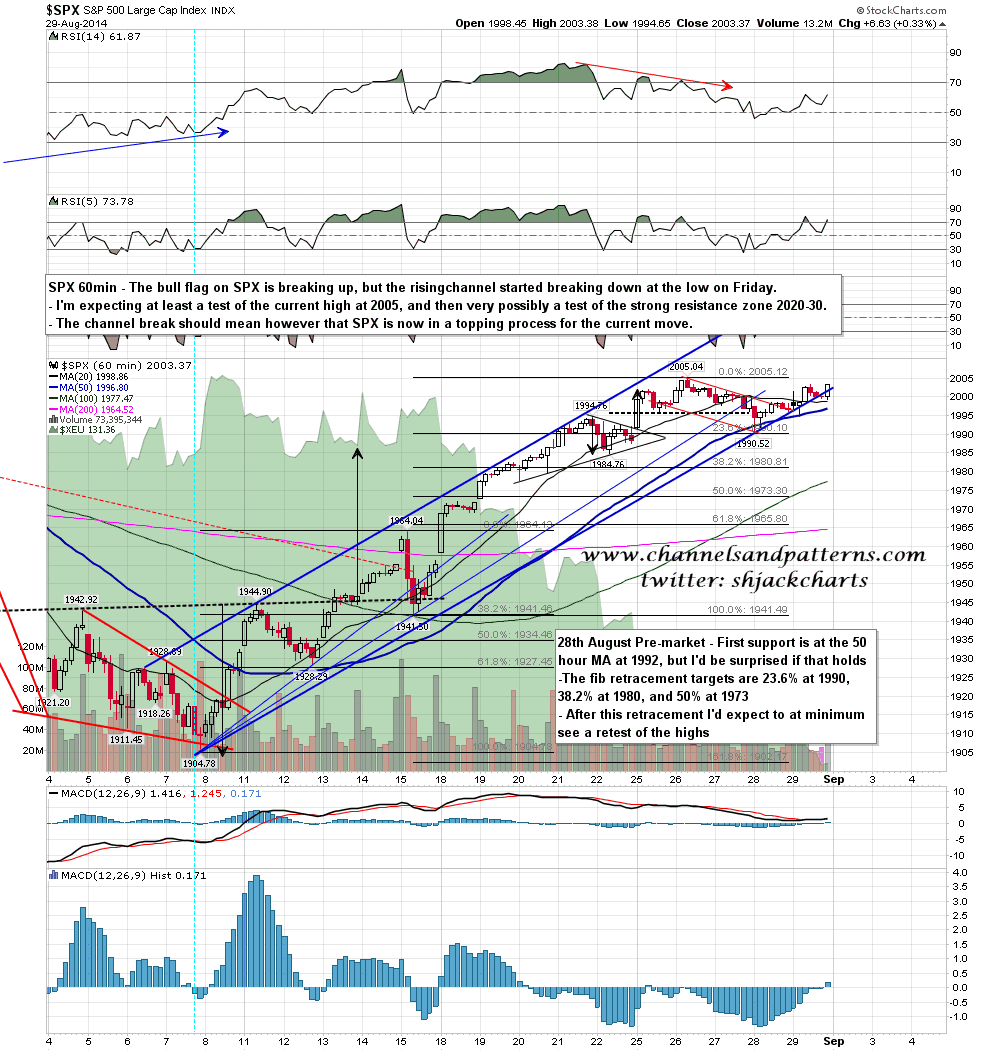
Somewhat to my surprise, the rising channel on SPX from the 1904 low that was established on Thursday was then broken at the low on Friday. That puts SPX in a likely topping process here and casts some significant doubt on the prospects of reaching 2020. We’ll see how it goes but I’d note that the daily RSI 5 and NYMO are showing a divergence that should, given a day where the a significant drop persisted into the close, trigger a high probability sell signal like the buy signal we saw shortly after the 1904 low. I’ll be watching for that signal and would strongly suggest at least cutting back some long exposure if that signal triggers. SPX 60min chart:
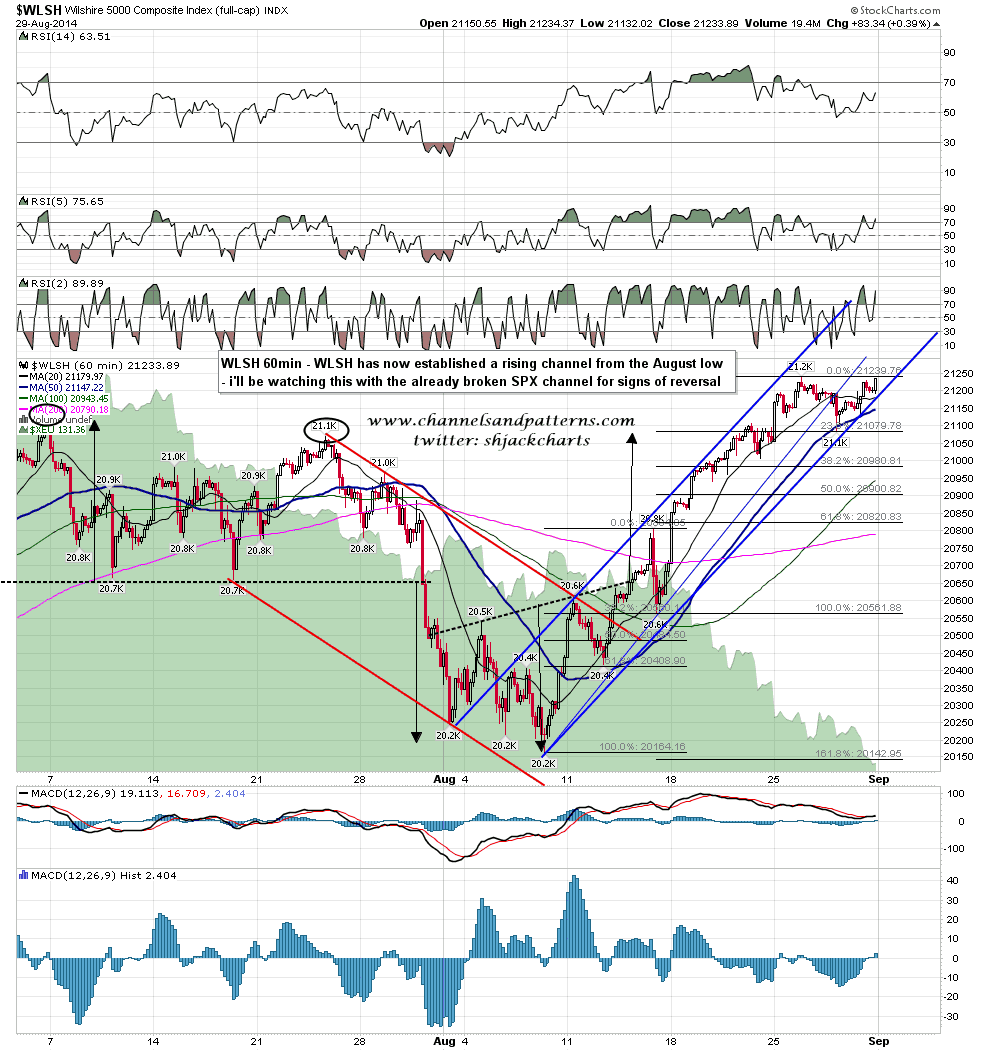
WLSH has also formed a decent rising channel from the August low, and that one hasn’t broken. I’ll be watching this with the SPX channel for signs of weakness. If we see both break again there will be a very good chance that the short term high would be in, and if bears could then break the 1904 SPX low, we should then see a correction to the 1800 area or lower. WLSH 60min chart:
I am very doubtful about much further upside here on this pattern setup. However I am expecting at least a test of the 2005 SPX high and a marginal higher high beyond that. SPX might run a bit further and the stats for today at least are bullish, with SPX up 12 of the last 18 first trading days of September. I am already watching for possible highs however, and if we see the expected strong day today, then I will be taking the view that a significant high could be made at any time after that.
