
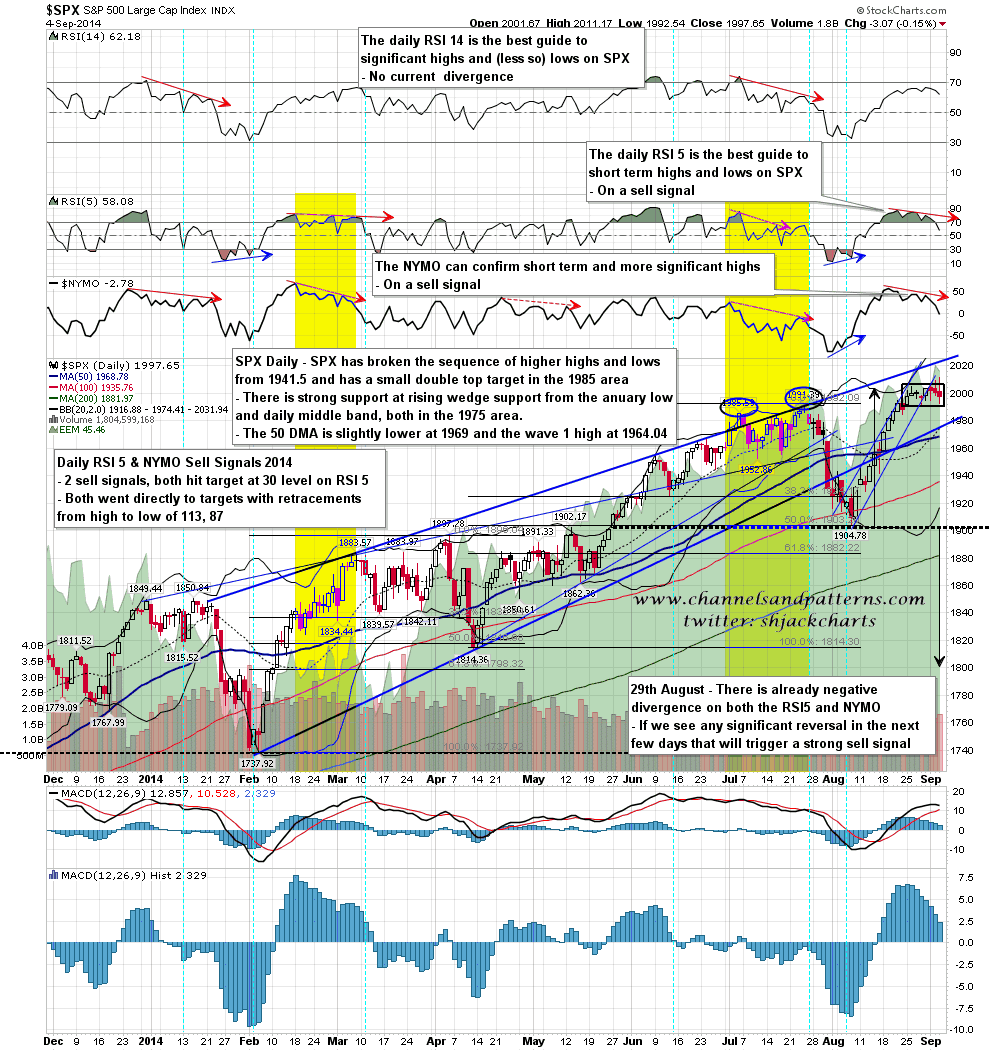
A daily RSI5 and NYMO sell signal fixed on SPX yesterday. I haven’t had enough time to run the performance on these back to the start of 2007 yet, but as there are eleven signals going back to the start of 2012, all in one of the most powerful bull runs in history, that’s a decent sample to use today.
The signals have a target at the 30 level on the daily RSI 5. Of the eleven previous signals eight went directly to target with retracements from high to low of 38, 55, 147, 55, 127, 45, 113 and 87.
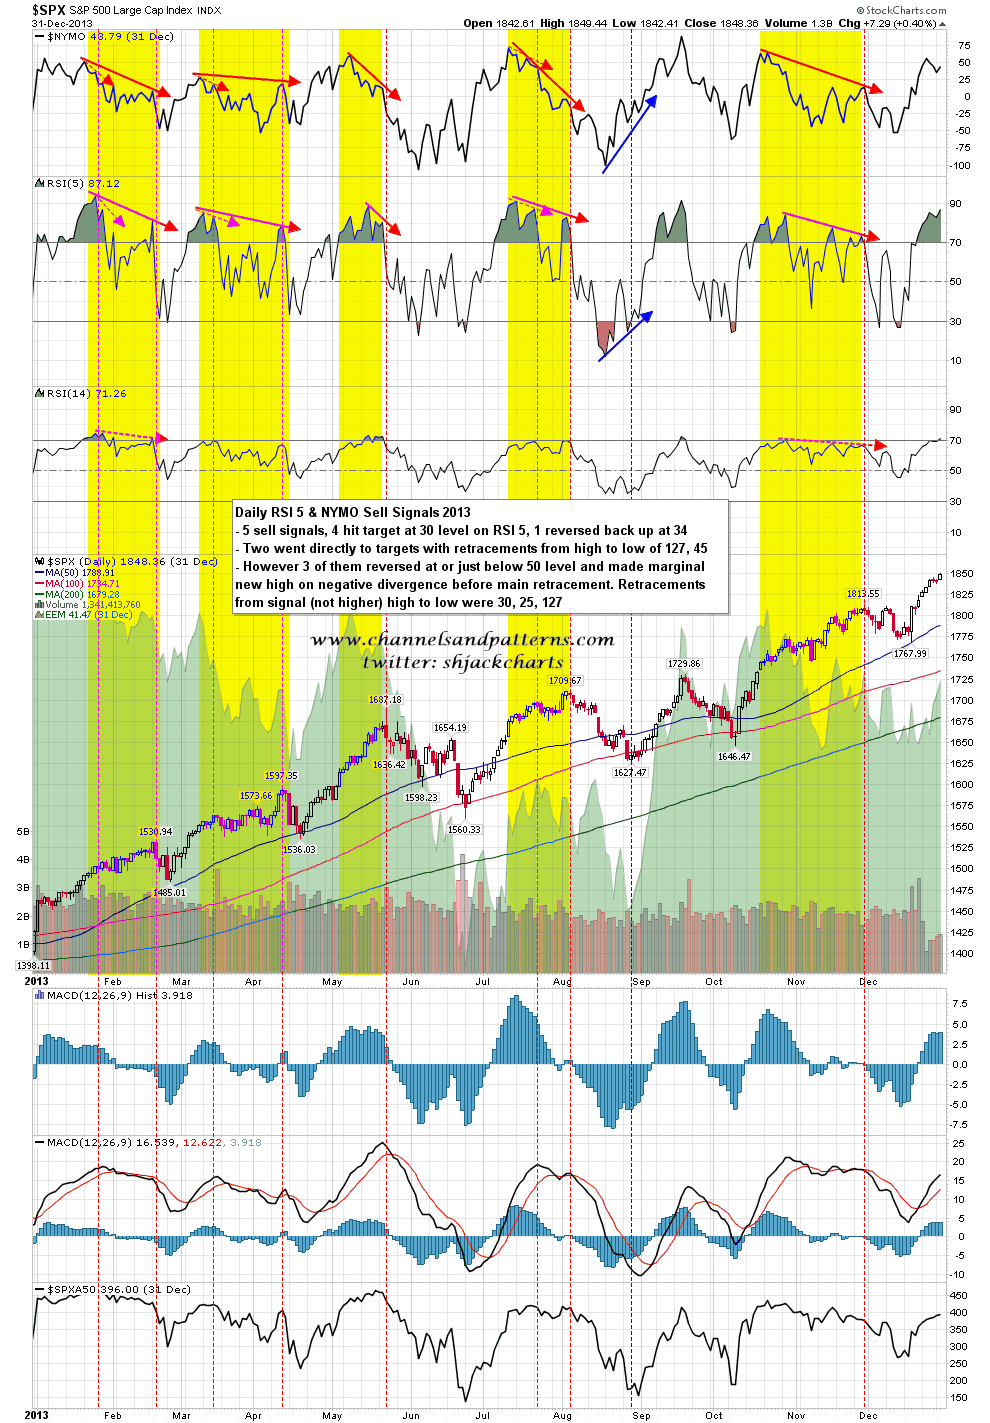
The other three signals (all in 2013) reversed at or slightly below the 50 level on the RSI 5, made a marginal new high on continuing negative RSI and NYMO divergence, before turning back down for a larger retracement to a low below the first low. Two of those made it to the 30 level target, and the third made it to 34, just short. The retracements from the signal (first not higher) high to the low were 30, 25, 127.
What does that tell us here? Well we could still make a marginal new high before the signal plays out, and the minimum likely target if we do make a new high from here would be 1986, so the low is most unlikely to be in. As the RSI 5 closed in the 58 area yesterday, we would also be unlikely to make a marginal new high without at least some further short term weakness to get the daily RSI 5 to 50.
What’s the takeaway here? Firstly the 1985 target on SPX should be made before any really serious reversal back up to retest the high, and that if we do make a new high from here, it should be marginal, and SPX should then make at least a lower low.
i am wondering about a retest of the highs here because I don’t currently see a topping pattern to take SPX back to possible double-top support at 1904, and while that’s not required, we may yet see it form.
On the SPX 60min chart SPX broke and closed below the 50 hour MA yesterday. That’s at 2001 and should now be resistance. I’ve disregarded the triangle after the odd second failed break up from it yesterday, but I’ve marked in double-top target in the 1985 area. My stats above are telling us that that target should be made (at least) before any attempt at retesting the high. SPX 60min chart:
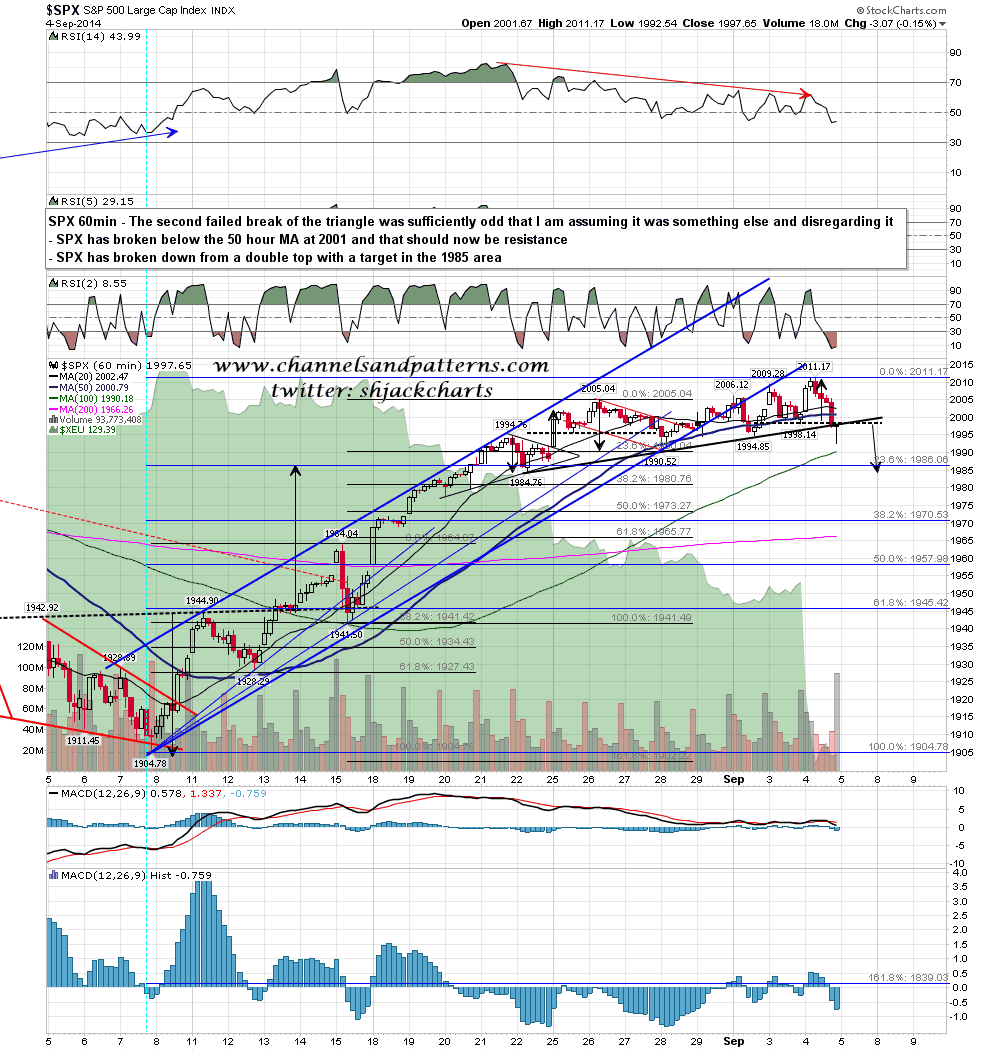
Beyond the 1985 target there is also strong double support in the 1975 area at rising wedge support from the January low and the daily middle band, then the 50 DMA at 1969 and the wave 1 high at 1964. If we see a move below 1964 I’ll be looking for a setup/pattern to retest 1904. SPX daily chart 2014:
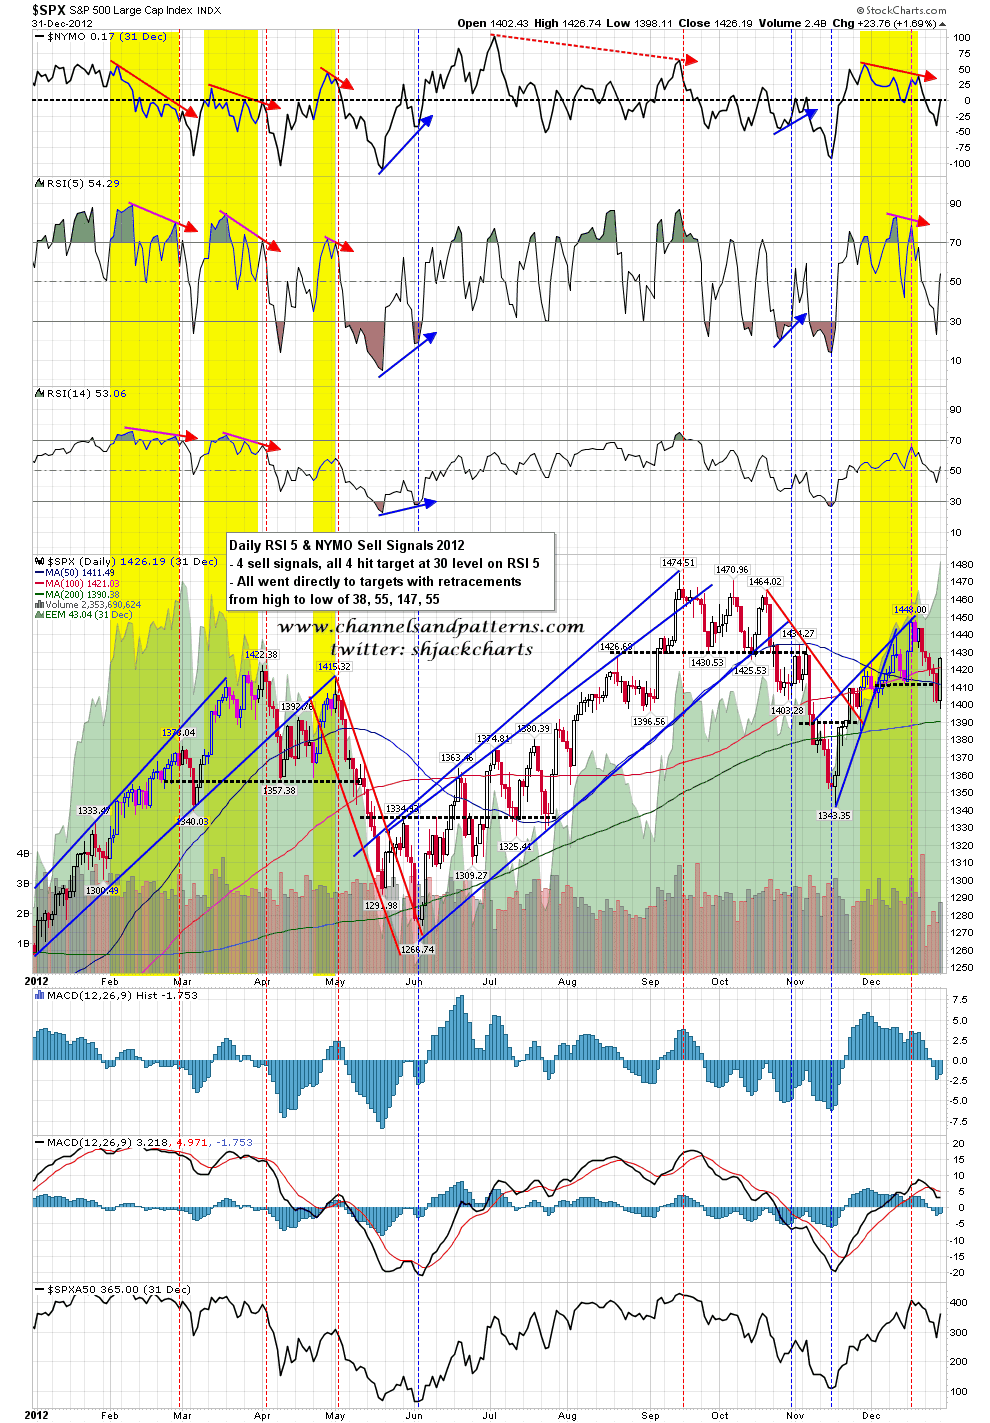
I’ve marked up the sell signals (yellow highlights) on the 2013 and 2012 daily chart for anyone to look at the past signals if they are interested. What I would remind everyone of is that this 2012-present period has been one of the strongest bull moves ever, and that nonetheless this counter-trend signal has performed very well during that period. SPX daily chart 2013:
SPX daily chart 2012:
NFP is in and the figures were bad. News is a funny thing nowadays. If we get good news the market goes up because the economy is improving. If the (economic) news is bad the market goes up because the Fed may extend QE and keep interest rates at zero for longer. Be that as it may I’m not expecting these numbers to change much about the short term outlook.
