
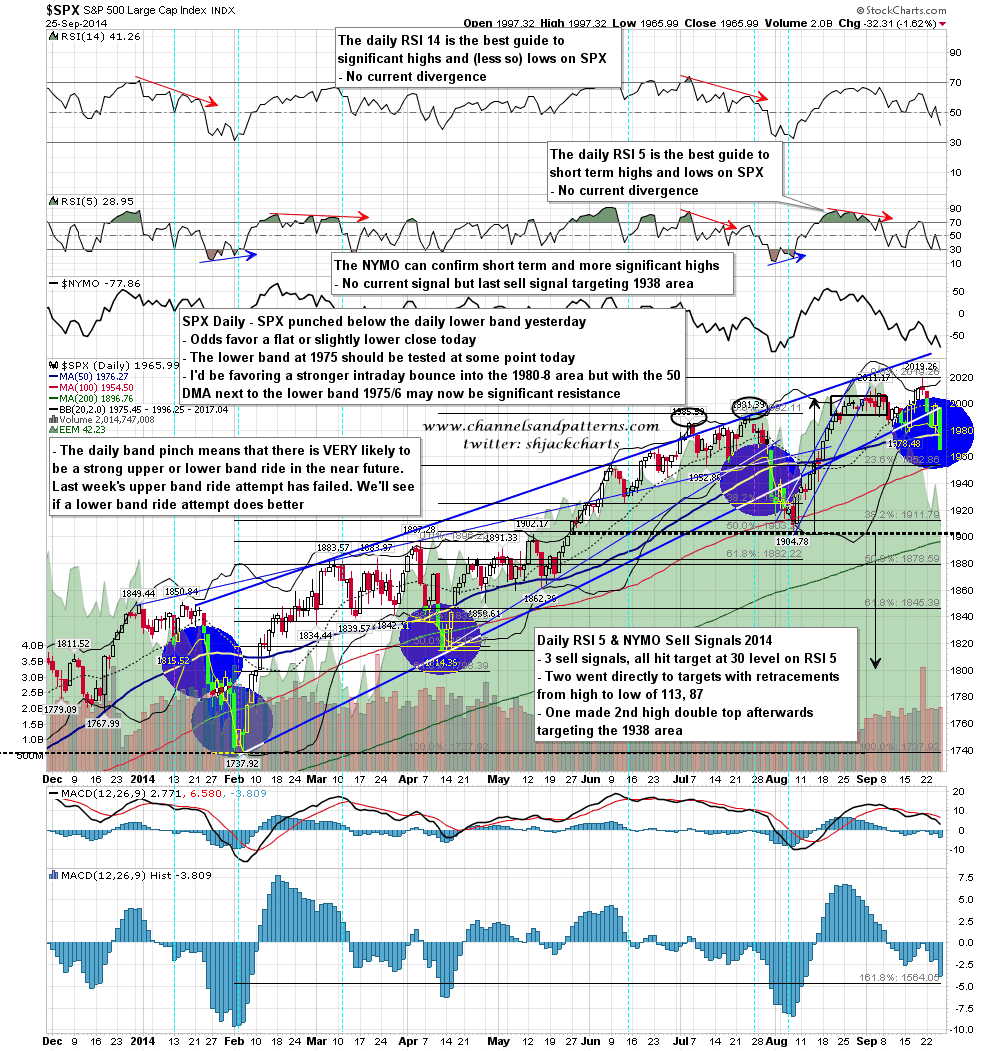
There were three significant technical landmarks for me yesterday. The first that double top support on SPX broke down, breaking the third and last support level I gave last Friday morning. The second was that the daily RSI 5 closed under 30, so the daily RSI 5 / NYMO sell signal I’ve been following has now unambiguously made target, though the historic stats on these nonetheless further support that the SPX double-top that has just broken down should make the pattern target in the 1937.70 area. The third was that a daily lower band ride was confirmed with the strong punch below the daily lower band.
So what now? Well the odds favor a lower close today, but not another trend day down. We may see a modest rally close or perhaps a flat close as a less likely but possible alternative. SPX should test the lower band at some point today, and that is currently at 1975. Yesterday’s low is very unlikely to hold and all longs should be counter-trend now until the double top target is hit. SPX daily chart:
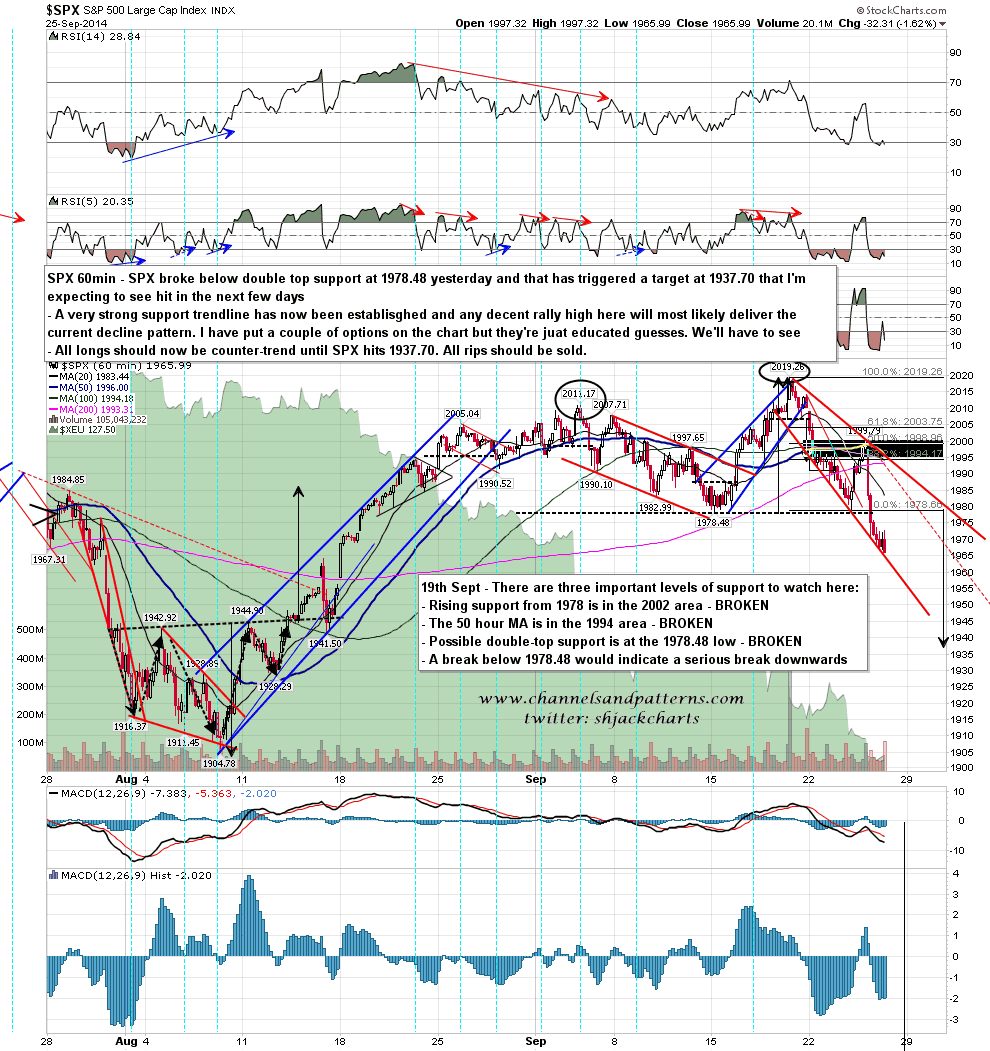
Looking closer the decline yesterday was stopped by a declining support trendline that was tested three times without breaking. The chances are that trendline will hold today and a decent bounce should be brewing. Hard to say where that bounce might top out, but if SPX can recover over the daily lower band and 50 DMA at 1975/6, then I have possible targets in the 1980-9 area. Wherever a significant bounce tops out should give us the decline pattern for the current move. I’ve marked a couple of options on the chart but these are just educated guesses. SPX 60min chart:
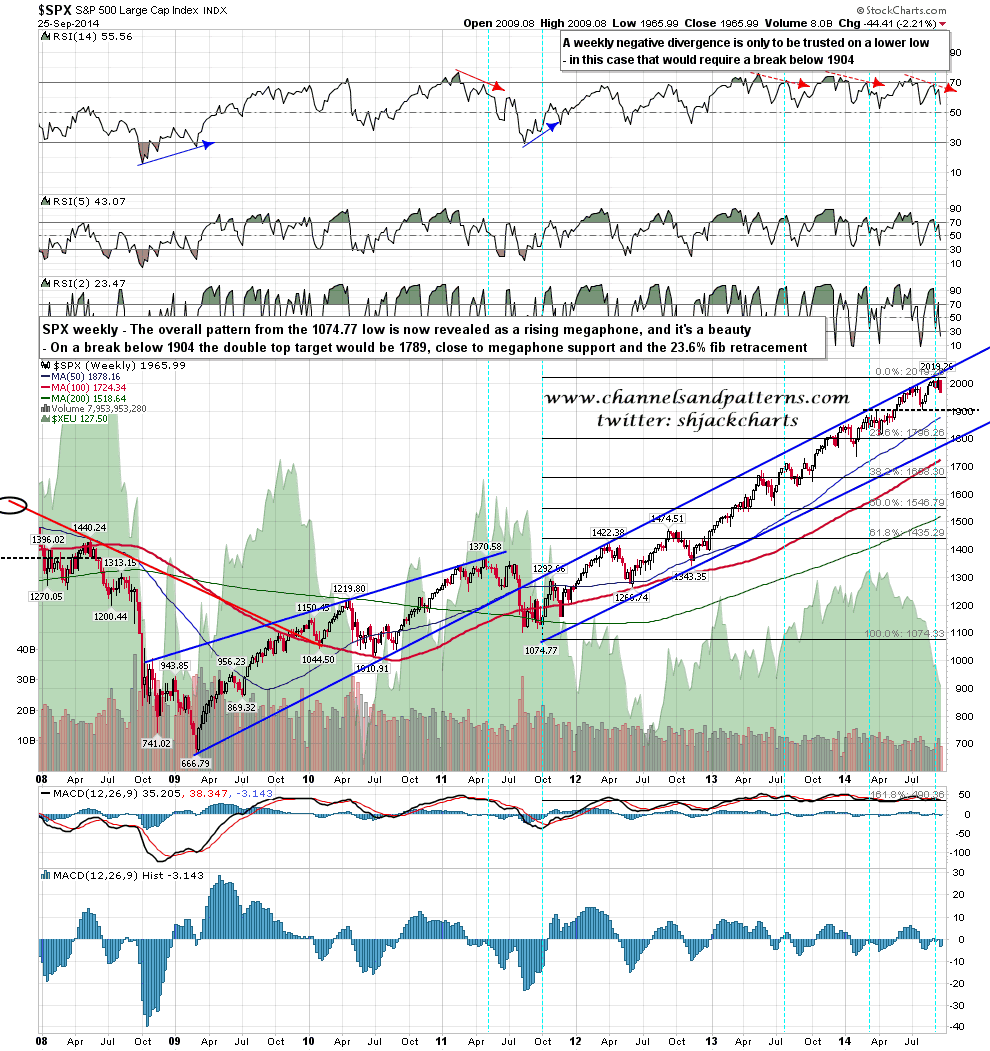
So where is all this going? Well The last highs have now finally given me enough data points to identify the primary pattern from the Oct 2011 low with some confidence, and it is a simply beautiful rising megaphone. The next obvious move within this pattern would be a test of megaphone support in the 1780-1800 area, and we have a double top setup that would target 1789 on a break below the 1904 low. SPX may well be starting that move now, though we’ll have to see whether the 1904 low can be broken before that can become a firm target. SPX weekly chart:
Essential points for today: – The daily lower band should be tested at some point today. There is strong bias on lower band ride days to see early highs that die. The odds strongly favor but don’t require a lower low today. The support trendline that held yesterday afternoon will most likely also hold today, so a decent bounce is most likely brewing here. Everyone have a great weekend 🙂
