Slope of Hope Blog Posts

Slope initially began as a blog, so this is where most of the website’s content resides. Here we have tens of thousands of posts dating back over a decade. These are listed in reverse chronological order. Click on any category icon below to see posts tagged with that particular subject, or click on a word in the category cloud on the right side of the screen for more specific choices.

Could Euro Fall This Far?

By -

It’s been a remarkably “thin” day on Slope, due to my being 95% occupied with familial duties. This morning, stripped of WiFi, I was totally dependent on a weak cell phone signal, tethered to my laptops, as my only link to the market (you try managing over 100 positions like that!) Mercifully, I was able to get my to my hotel room for a few hours to get a bunch of trades in before the close.

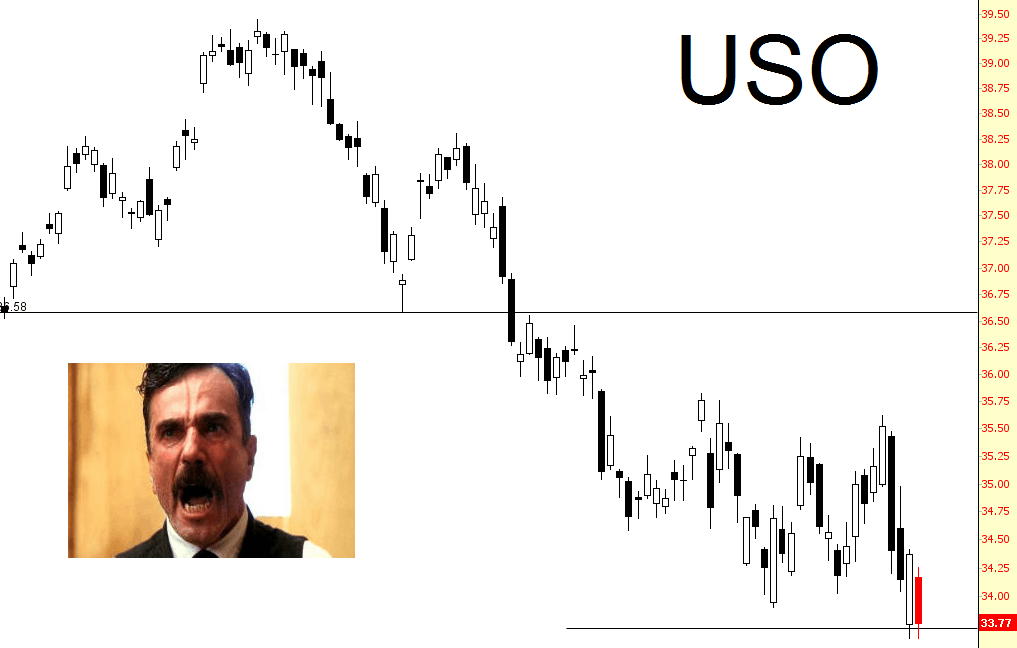
I’ve got a anecdotal post in mind, but it’s going to take me a little while to write it, so I’ll just keep it simple now and share a single chart: the Euro/US Dollar cross rate has been in its own bear market since May 7th (can you imagine equities consistently sinking for that length of time? The Fed would be apoplectic!) With it, just about everything you can hold in your hand – – gold, silver, crude oil, copper – – has been barfing. (more…)

A Gift from the Gods

By -

This will be my only post today because something something family obligations something something ungodly buried something no WiFi. OK?

Anyway.

Yesterday afternoon, after a trading friend of mine wrote me about the amazing change we’re seeing in the market, I wrote him the following (and I will note this was yesterday afternoon, long before today’s rally was even on the horizon); I’ve put a few bits in bold: (more…)

Show Us The Money

By -

I posted the chart below on twitter last night, and that shows SPX making the double-top target at 1937.70, then underthrowing falling megaphone support before rallying hard to form a nice looking IHS targeting the 1980 area.

I have to say I wasn’t wild about the low, which was in the right area but unusually didn’t show positive RSI divergence on any timeframe, but as long as the IHS breaks up today I’ll be taking that 1980 target seriously, and would note that the 50 DMA is now at 1975, and the 61.8% fib retrace and the daily middle band are both currently at 1985. This target would be a reasonable rally target and this would clear the pattern setup nicely for the next and likely much larger move down. SPX 5min chart: (more…)