
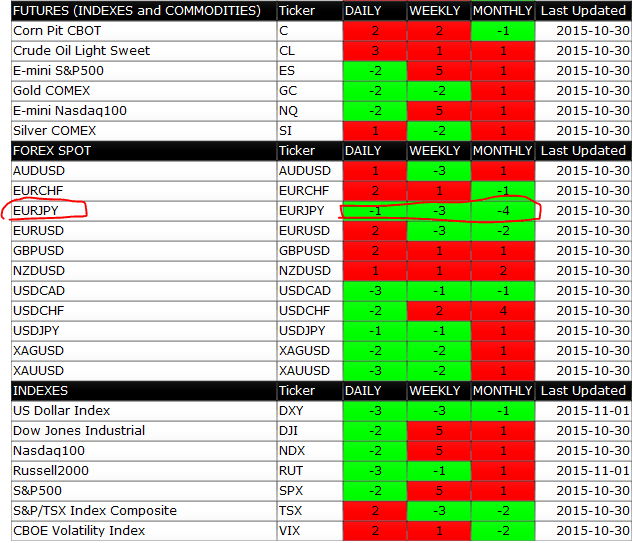
The table below is part of a service that we offer to our paying subscribers and it shows a comparative view of the number of consecutive price closes in the same direction, across 3 time periods: DAILY, WEEKLY and MONTHLY, for a number of ETFs, Futures, FX Spot and Indices (the complete coverage list can be found on our website).
After the Daily, Weekly and Monthly Close last Friday, all the values in this table have been regenerated and we thought of offering a snippet of it to the SOH readers.
What is this useful for? Well, assuming that markets do not trend forever in the same direction (this is a proven historical fact at ANY time period examined, 1 minute, 5 minutes, daily, etc.), then we should expect a reversion at one point and most likely the reversion will be easier to predict once a certain market is over-extended in one direction.
Red color code means the price was trending up for x days, weeks or months.
Green color code means the price was trending down for x days, weeks or months.
What we are looking for in this table? Simple: markets that are showing the same color (i.e. all green or all red) across all time periods and possibly a large number of consecutive closes (e.g. 2 or more).
Take the EURJPY, for example, it has been down -4 months, -3 weeks and -1 day (last Friday). This is a classic example of OVERSOLD market and you can see it at a glance and compare it with other markets, to get a overview of what is happening across the broad market, what assets are up and what assets are down. In this case we would recommend LONG trades on EURJPY as it has good chances to recover and go higher this month.
To improve your entry point, you may want to gain access to the EURJPY model LONG, that will give you precise information on what levels are best to trade, for example the screenshot below shows that from 131.96 the odds of success for a LONG DAILY trade for today are good (these tools can be used in discretionary fashion to support your own signals/analysis or by using our own systematic trading method).

Click here if you want to gain access to all our quantitative trading models, we cover a number of selected ETFs, FX Spot, Indices and Futures markets (full list).
