
Silver has been battered in the last 6 days, together with Gold, 6 days down in a row. It is not impossible to see it going lower, but once a price move overshoots in one direction at one point it stops and it retraces back. This is the core of our analysis: to identify through a statistical complex model where the ride ends, where a market reaches the limits of its current price move and reverses (sometimes temporarily) its trend direction.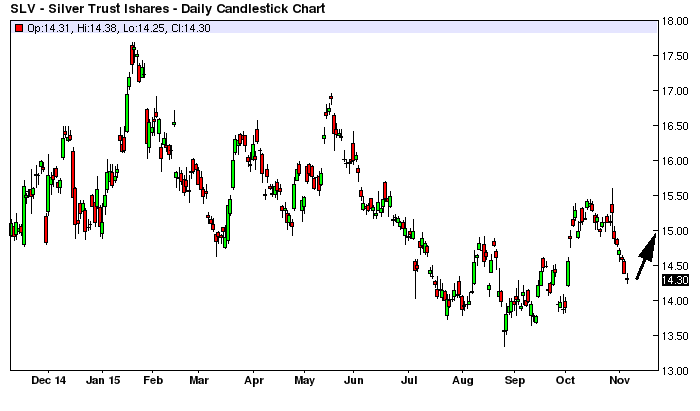
SLV (chart above) is currently reaching the limit of the DAILY OVERSOLD scale , according to our LONG model, pictured below:

Let us explain the options offered by our auto-calculating trading model: you can use a Stop Loss trading method (highlighted in yellow) or a Averaging Down trading method (highlighted in red) and you can customize position size as you want to fit your wallet. In the example above you can see the total capital needed to take these trades is 5964$ for one system and 4302$ for the other, affordable for most retail traders. This can be scaled up to any size, even if you are a fund you can use this with millions of dollars – as long as market liquidity is sufficient to avoid slippage/market impact that will push up the price as you buy (we doubt any of you is going to have this problem).
The low yesterday was 14.25, so if you were using this model, you would have bought at 14.34 and waiting for a bounce, and buy again at 13.78 (or if you have a Stop Loss method you exit at 14.16 and re-enter at 13.78).
This is systematic mechanical trading that any trader can do and our clients have been multi-year successful at this, because our system/model gives them an edge to beat the market (sorry for the promotional pimp moment).
You can see the model also tells you what Loss you may incur, for example 177$ for the Stop Loss method, with a minimum possible gain of 171 at a target price of 15.00, which is almost a 1:1 risk reward (discussion gets complex here, but let’s say we are just showing there is a good relationship between gains and losses, and our system win/loss ratio is very strongly skewed towards the win side, although this depends in part of the trader).
How do we estimate the profit target? Various methods, one is by looking at the opposite direction of the trade, i.e. the SLV SHORT model (see graph below). You see that area highlighted in yellow? That is statistically where the market reaches most frequently on this specific retracement pattern when it bounces from its lows (please note these models are updated every day, so they change and adapt to market conditions, what is valid target today may be not valid tomorrow). So the ideal range where you want to take profit before you lose it all is 14.42~15.15. Take note of this freebie information, if you are trading SLV LONG.
This is why you need our model: to know what the market does on average, to forecast where it can go based on its statistical behavior, which is the only reasonable and scientific path to predict the extension of price moves with some precision.
Even if you do not want to trade with our trading system, the RL model will tell you where the price can reach, so you don’t hold your trades beyond the point where it pulls back and you don’t stay short beyond the point where the market is going to rebound back in your face. Take it as a discretionary tool to help you define the range of price movements, it can greatly increase your ability to predict and understand how the market will move next.
Click here if you want to gain access to all our quantitative trading models, we cover a number of selected ETFs, FX Spot, Indices and Futures markets (full list).

