
I posted my daily premarket video for subscribers to the Daily Video Service at the artofchart.net on twitter this morning, because there was a serious chance of a bull breakout on the opening setup. That’s fading a bit now, with SPX failing at the retest of the 50 hour MA at 2141, but it’s still possible, and on a break above then main (closing) resistance is at the daily middle band in the 2153 area. You can see that premarket video here. SPX daily chart:

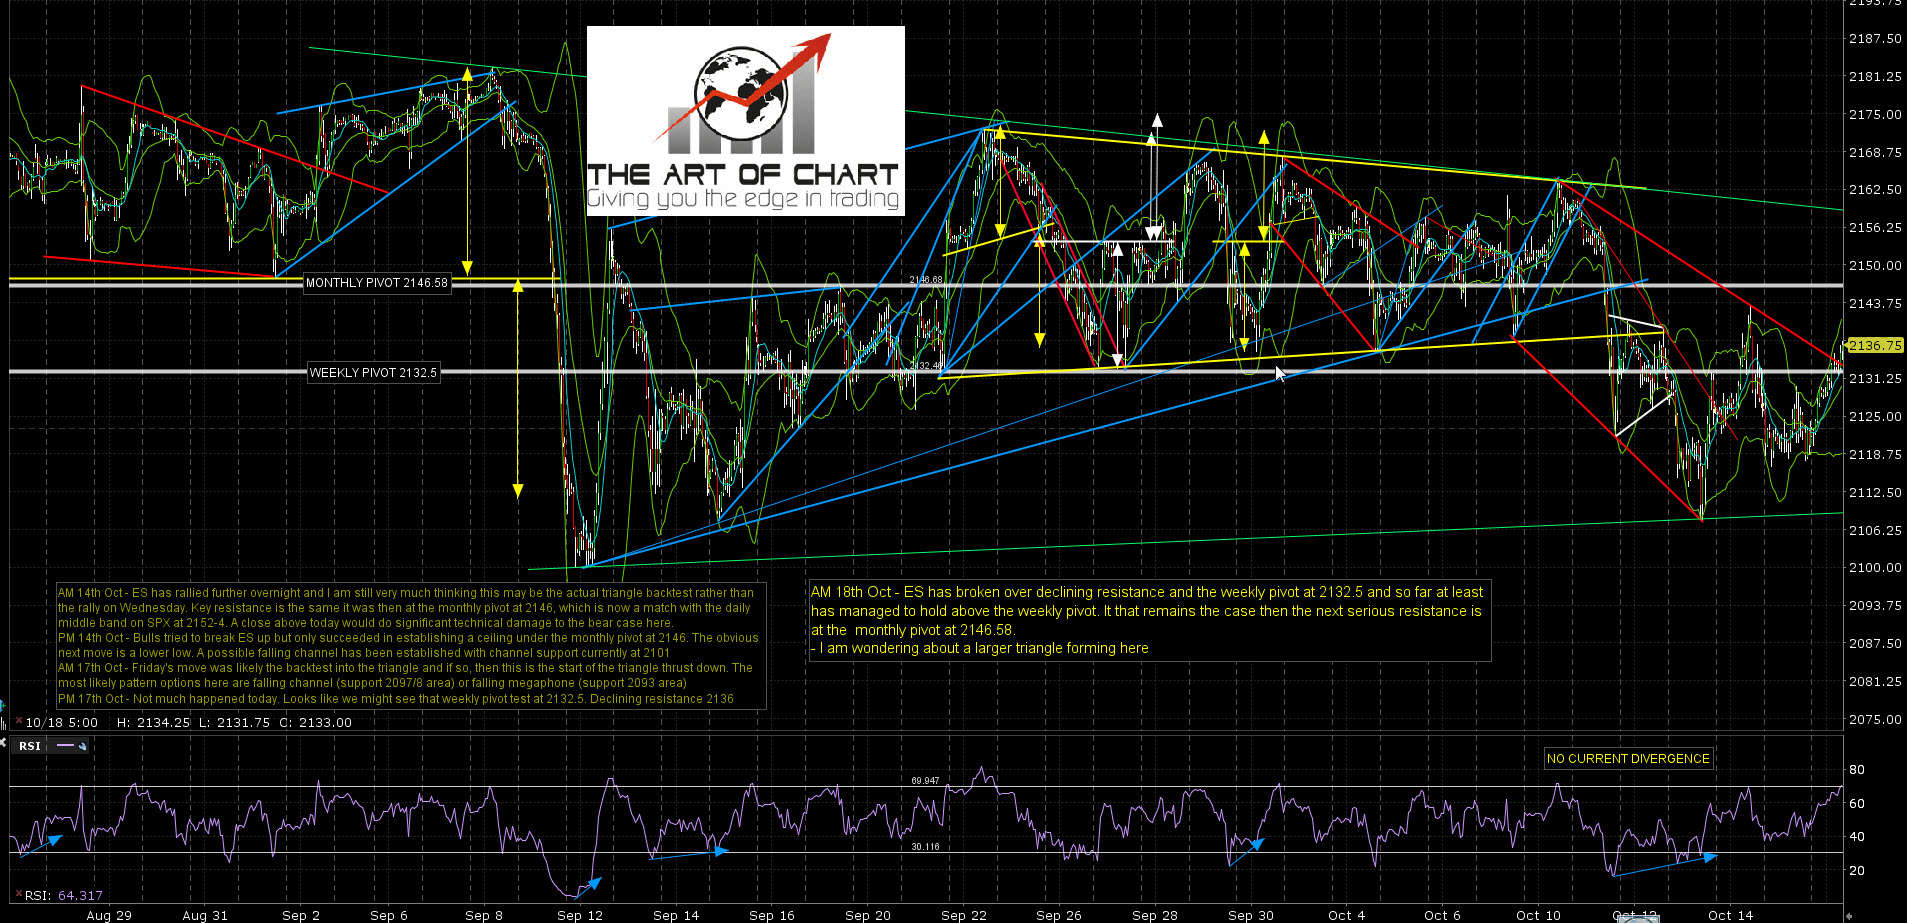
These charts are the ones I used in the video before the open, but the key on ES, being tested at the time of writing, is the weekly pivot at 2132.5. Bulls need to convert it to support to open higher targets. Bears have to hold it as resistance as a break above and conversion to support opens a test of the monthly pivot at 2146.5, in effect a test of the daily middle band on SPX. ES Dec 60min chart:
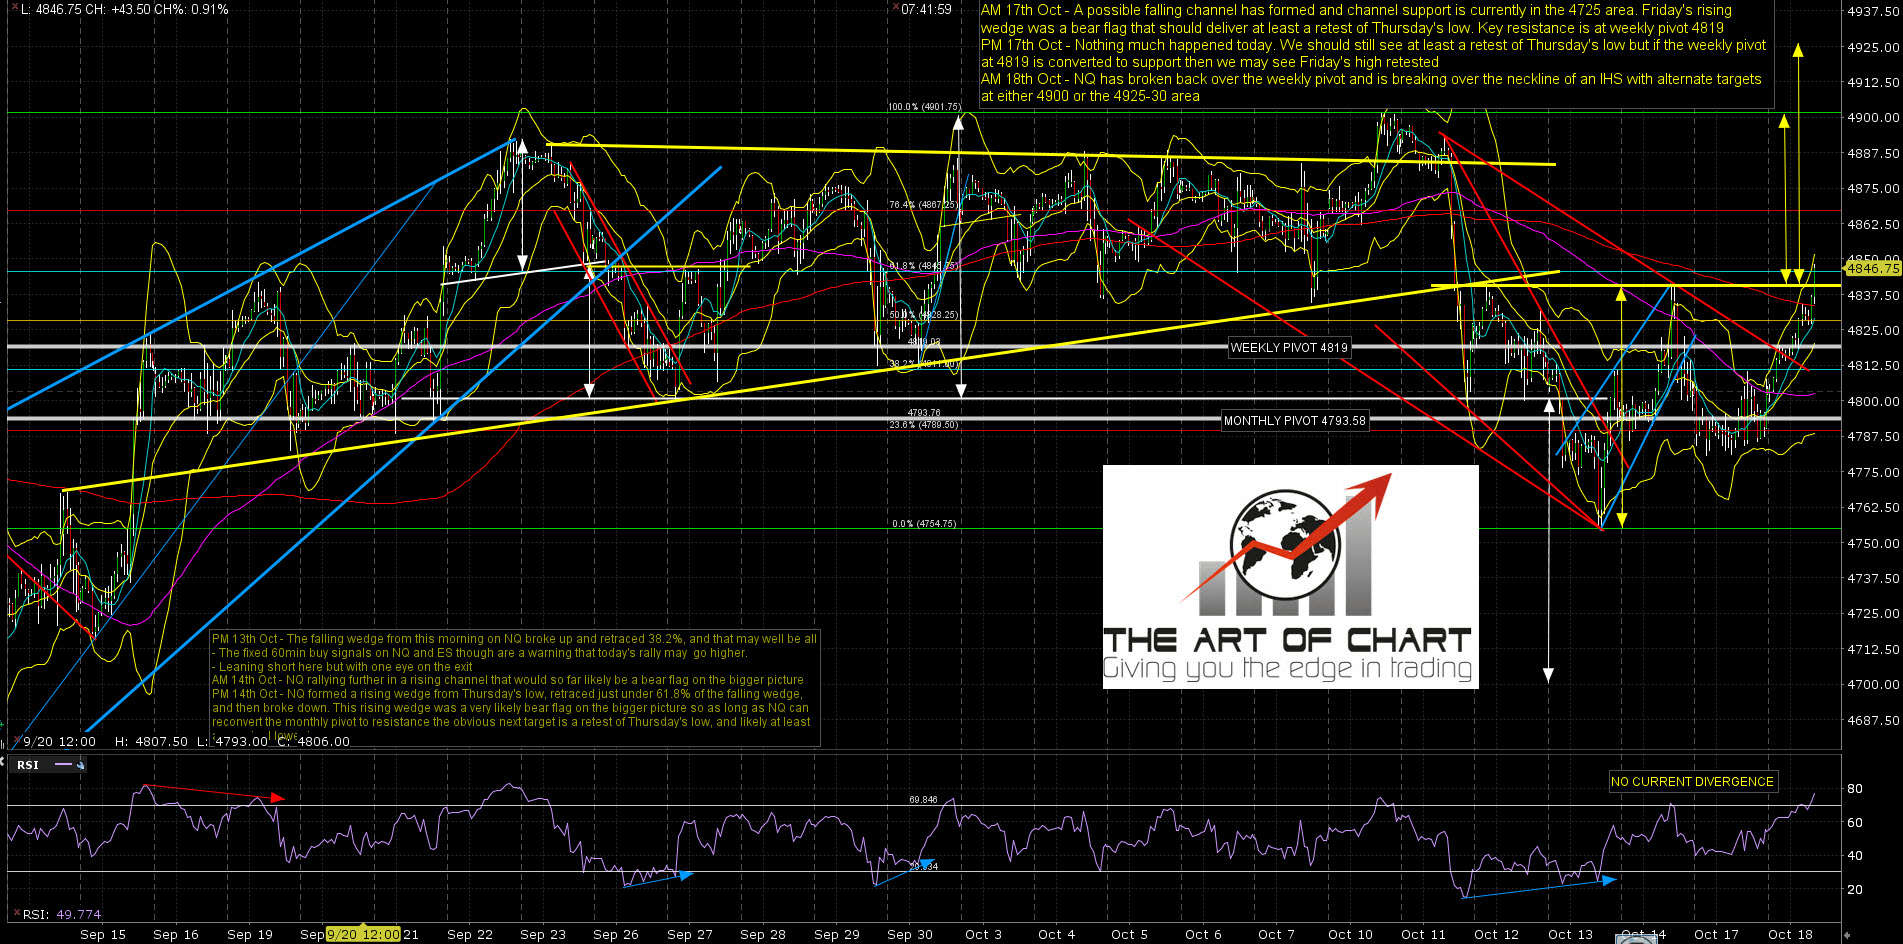
On NQ there is a very decent looking IHS that is trying to break up with a target back at the all time highs. I’m watching that carefully. NQ Dec 60min chart:
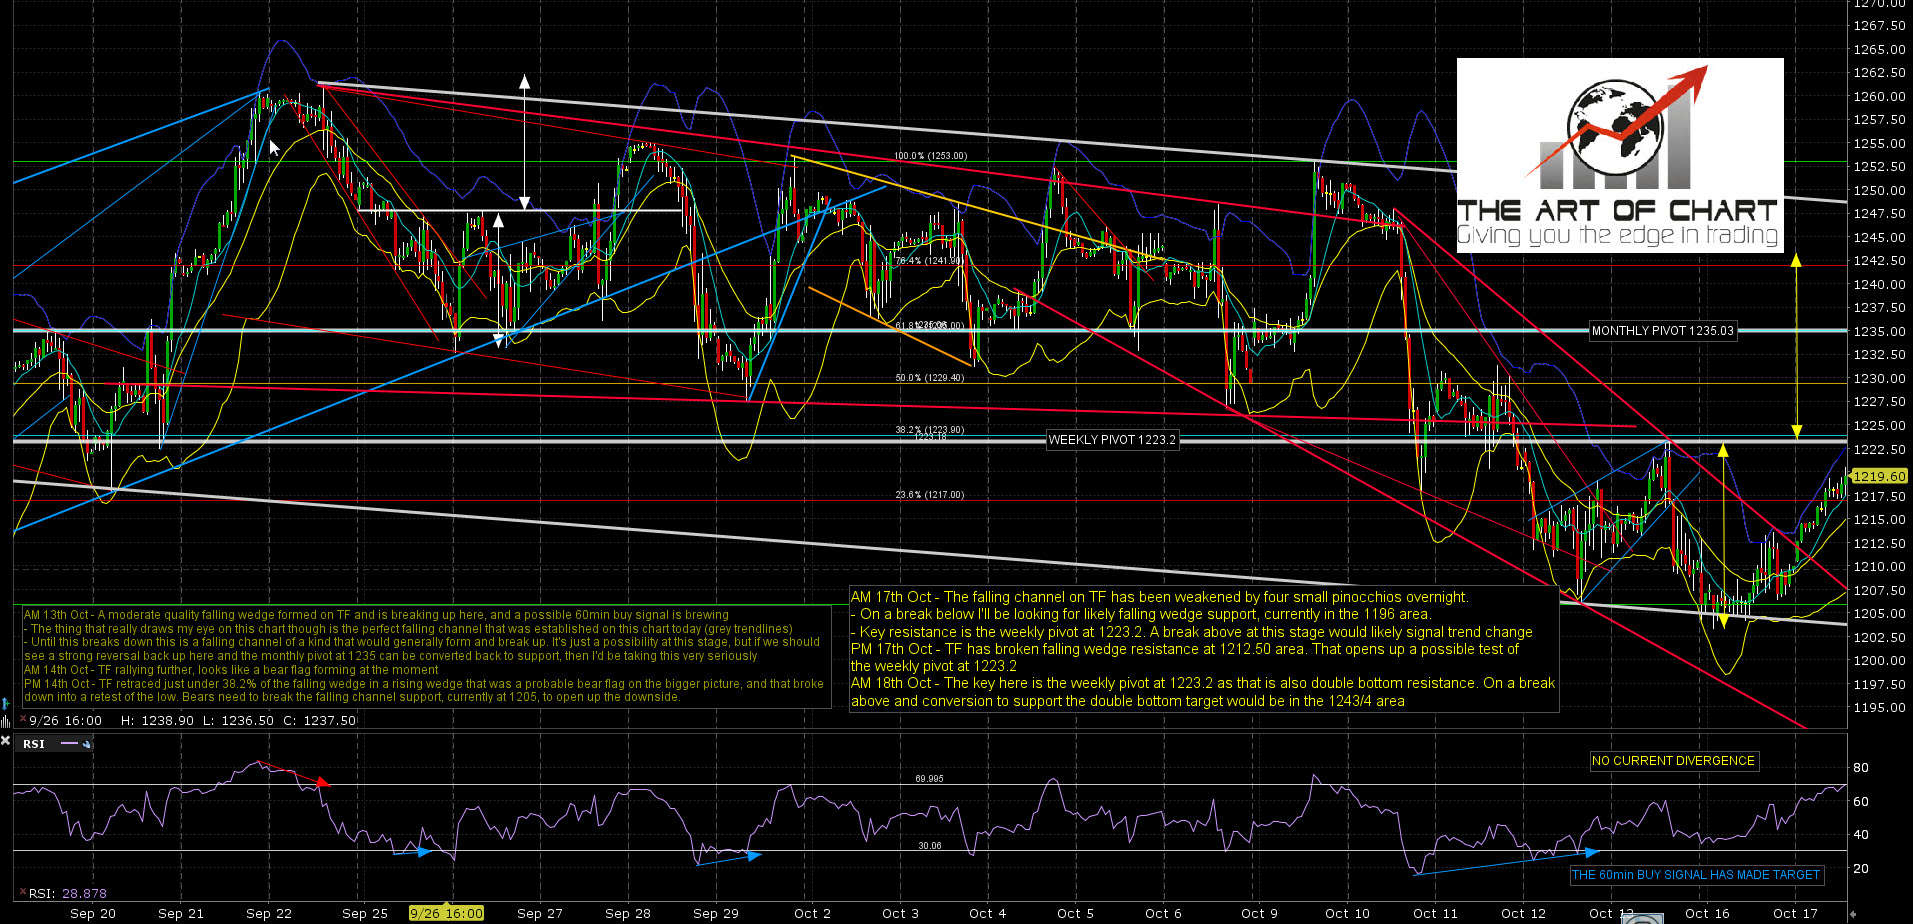
On TF there is a decent looking double bottom part-formed, possibly it might be a part-formed IHS, but either way the key resistance level is the weekly pivot at 1223. Conversion of that level to support opens a target in the 1243/4 area, and a very possible test of channel resistance in the 1249 area. TF is very very good technical instrument so I’ll be watching it very carefully. TF Dec 60min chart:
I’m getting edgy about this downtrend because we are seeing too much bull strength. After Friday’s high there should have been a retest of Thursday’s low before the next serious attempt at a rally, and we didn’t see that. Stan’s theory is that this is some kind of bull flag forming on the bigger picture, and that ES will likely make a low this week in the 2100 area or above. He may well be right.
