
It seems that I don’t post very much on oil (or Natural Gas, for that matter). These are covered each weekend in NFTRH; but yes it’s true, I give oil and energy short shrift in public posting. Probably because I have other higher priority interests right now.
But a subscriber asked about shorting oil in light of the fading efficacy of the OPEC deal, Elliott Wave’s (I assume he means EWI) apparent target of $56 with a crash due thereafter, and Sentimentrader’s high risk sentiment reading. So let’s look into it.
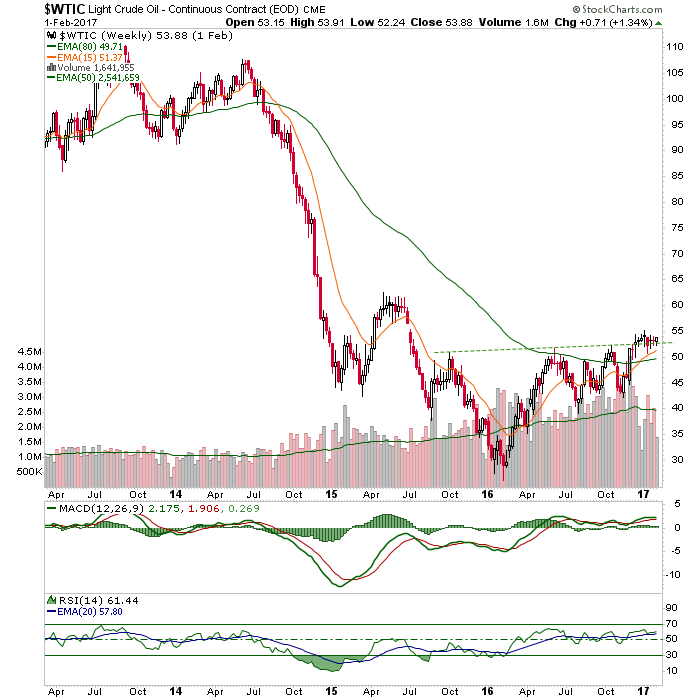
WTI Crude Oil is bullish above key support by daily chart.

WTIC weekly is in a constructive looking pattern and above the pattern’s neckline. Two moving averages have crossed for the first time since triggering a big bear phase back in 2014. When they crossed down the damage was immense. It sure can’t hurt the bullish case that they’ve crossed upward. If this pattern remains intact (i.e. WTIC above the neckline) the target is around 75.
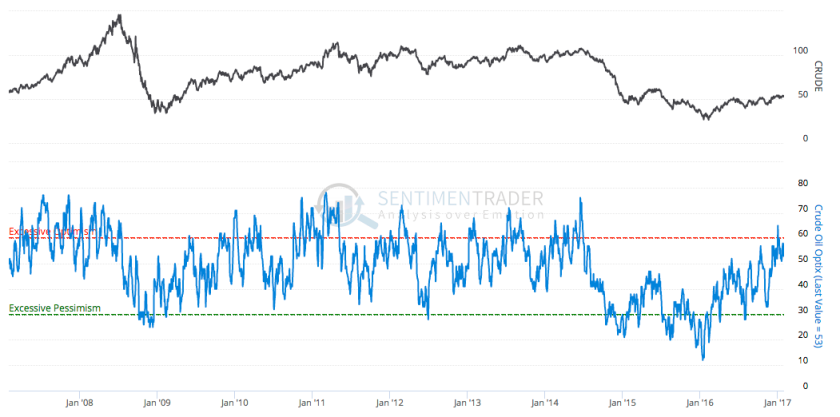
On the sentiment front, here is the above average risk per Sentimentrader‘s amalgamated data that we review each week for multiple markets. I recommend Sentimentrader by the way, for anyone wanting in-depth sentiment data at their fingertips.
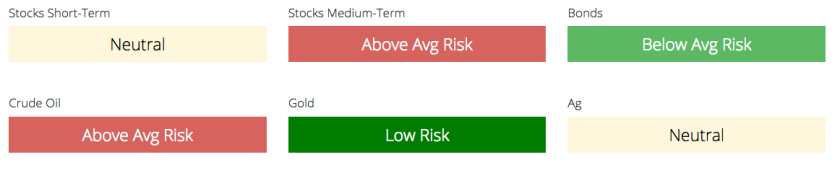
Looking more closely into the particulars, we find the Commercial Hedgers very net short this commodity. They are considered smart money.
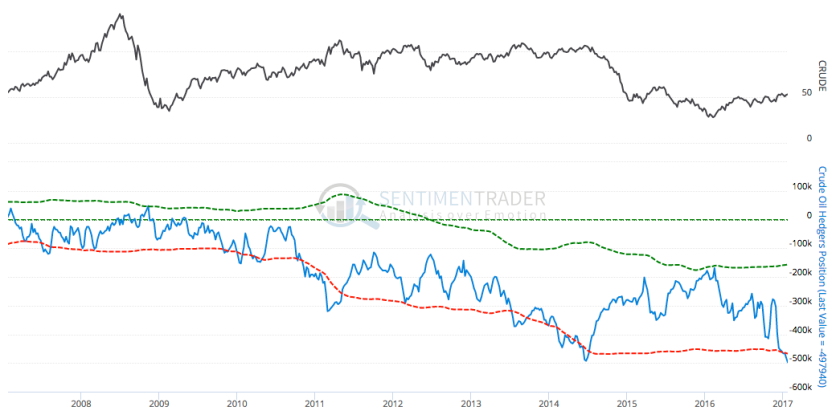
We also find the Public to be moderately over bullish.
Neither of the two graphs above are constructive for the bullish case for oil.
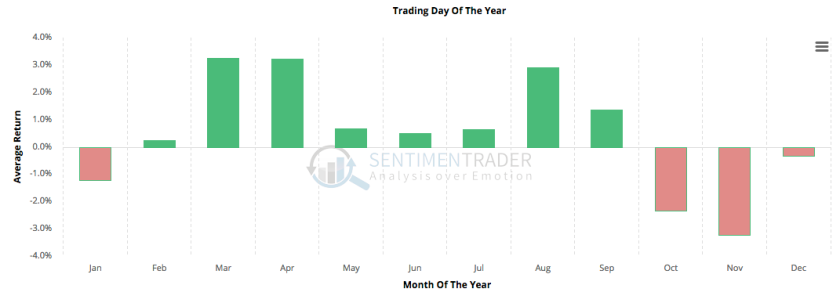
Finally, we have the seasonality for Crude Oil based on 30 years of data. This argues for the bullish case.
Bottom Line
The daily and weekly charts are still bullish. What’s more, the measured target is 75 (as opposed to Elliott Wave’s 56) if the price holds current support at the neckline. Sentiment is in a bearish alignment and seasonality is positive. From the buzz I hear, the fundamentals are a tenuous OPEC price control operation vs. high inventory levels.
At the very least, to answer the subscriber’s question; if you’re going to short it might be worth waiting for a break of support. Commercial traders can remain net short for extended periods and are not necessarily shorting to be bearish. A large portion of them are hedging, after all. Technically, the charts are what they are right now. If Elliott Wave analysis is saying something else, have at it if it makes sense to you. I am simpler chart guy however, and I just don’t see it yet, technically speaking.
Another thing worth considering is that Commercial Hedgers are very net long US Treasury bonds, as we have been noting. So putting on our macro hat might the combination of the extreme long in Treasury bonds and the extreme short in this headline commodity line up with our expected flame out (for a correction at least) in many financial markets? The rough time frame I have to this favored plan is March/April. So maybe it is not only crude that will eventually drop after hitting whatever highs it plans to hit in the near-term.
Subscribe to NFTRH Premium for your 30-45 page weekly report, interim updates and NFTRH+ chart and trade ideas or the free eLetter for an introduction to our work. Or simply keep up to date with plenty of public content at NFTRH.com and Biiwii.com. Also, you can follow via Twitter @BiiwiiNFTRH, StockTwits or RSS.
