
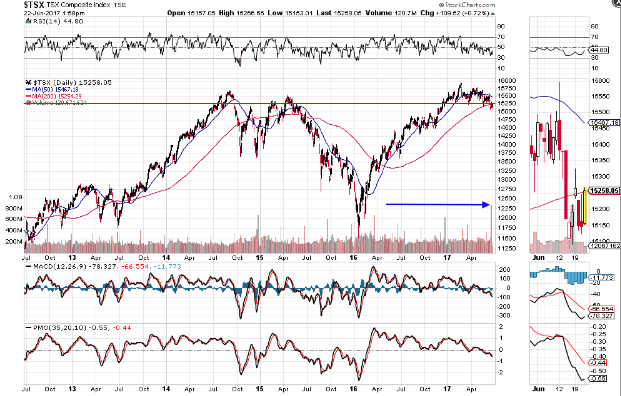
After reaching all-time highs earlier this year, Canada’s TSX Index has dropped to around the 15,250 level, as shown on the following Monthly chart…an important long-term major support/resistance level.

The latest drop has been halted by a very high volume spike around the 200-day moving average, shown on the Daily chart below.
This index has, historically, been tied to the price of crude oil, as can be seen on the graph below, although it didn’t experience the same dramatic drop as oil did in 2014.
So, as I mentioned in my post of June 21, if oil can regain and hold 43.50, and if the recent high-volume spike on the TSX was an indication of capitulation, we may see a rally ensue in both of these markets. Otherwise, weakness in one may drag the other down, as well…two charts worth watching in the short term.

