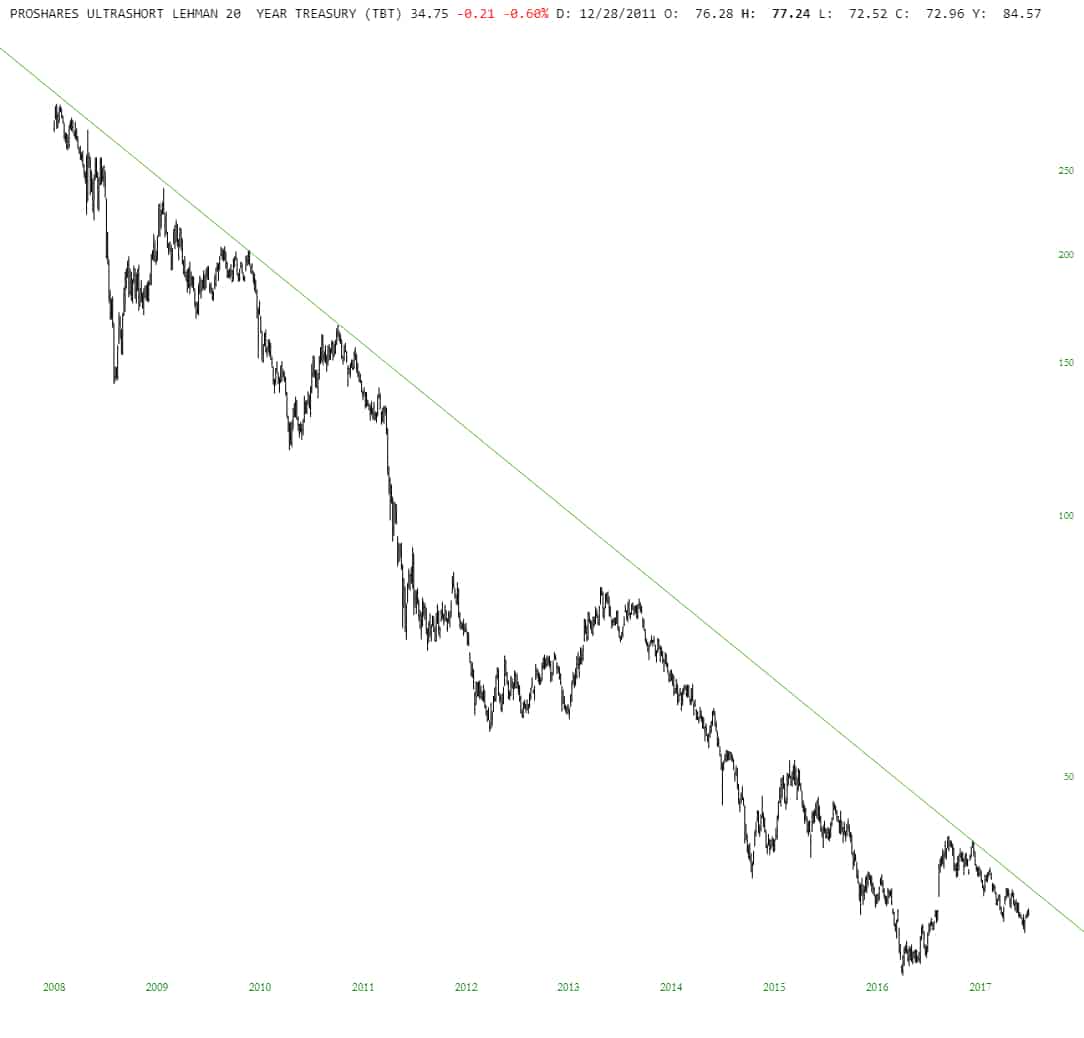
On September 6, with the ProShares UltraShort 20+ Year Treasury (TBT) reaching a new low (33.32) in its 7-month corrective process, we noted that “Dec-Sep correction could be at or nearing a downside exhaustion.”
Our RSI and MACD indicators showed a glaring non-confirmation of the low — and sure enough after the TBT dipped to a new low of 32.99 the next day, it went on to rally over the next four sessions, and reached a high of 35.25 this past Wednesday.
On that same day, Wed Sep 20, the Federal Open Market Committee said it will keep the federal funds rate in a range of 1-1.25%, but Fed officials intimated that they may raise rates one more time by year-end, and three times during 2018, in addition to starting Quantitative Tightening in October– the slow, steady reduction of its bloated $4.5 trillion balance sheet.
With the Fed intending to normalize monetary policy after years of “easy money,” 10-Year Yield has been in a 14-month budding bull market (which is bullish for the TBT).
The bull market in yield began with the July 2016 low of 1.32%, which ended the 35-year bear market.
As long as any forthcoming weakness in yield preserves 2.03%, my preferred scenario calls for buying pullbacks in the 2.16%- 2.12% support zone (if able) ahead of a powerful next upleg.
What exactly could or will be the catalyst for the emergence of the next powerful upleg in yield is anyone’s guess, from a sudden surge in latent inflation precipitated by a resumption of acute US Dollar weakness, to a surprising passage of stimulus and tax reduction legislation that elevates growth and inflationary expectations, to a loss of bond investor confidence in the efficacy of the Trump Administration.
Whatever the supposed reasons, all eyes on two yield levels: the recent low-zone at 2.10%-2.04%, and key resistance at 2.37%-2.40%, which if (when?) taken out, will trigger new, powerful buy signals for both yield and the TBT.