
It appears that several international Financial ETFs have, generally, performed well over the past couple of years and are, either approaching major resistance, or have already reached it, when compared with their respective country’s Major Index on a ratio basis.
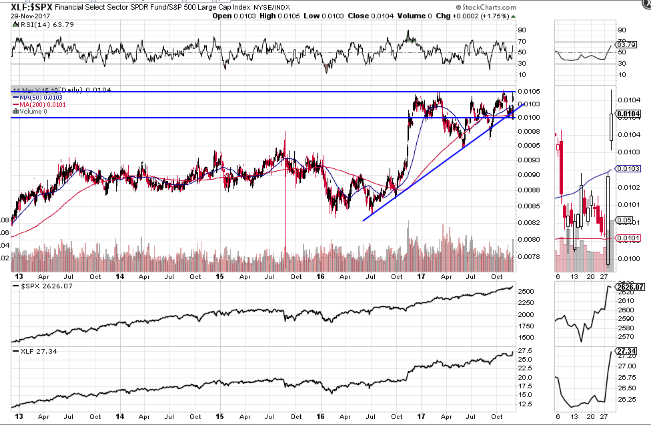
The first is the XLF:$SPX ratio, as shown on the 5-Year Daily ratio chart below.
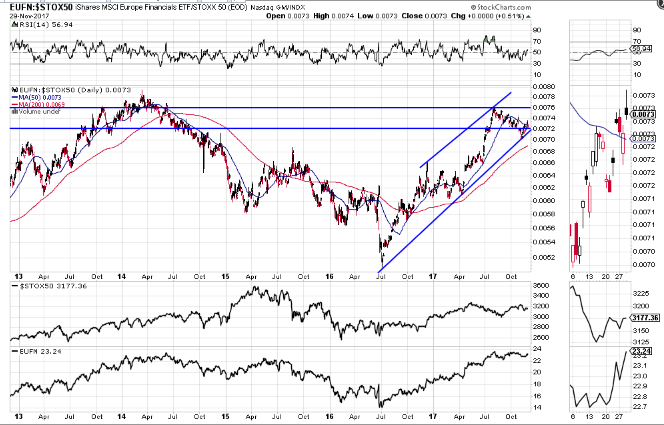
The second is the EUFN:$STOX50 ratio, as shown on the 5-Year Daily ratio chart below.
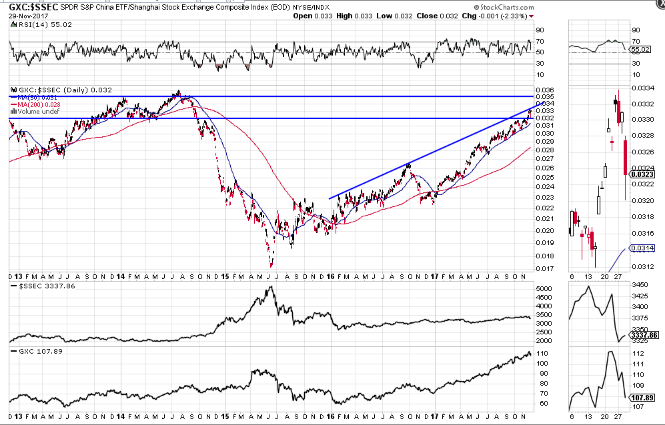
The last is the GXC:$SSEC ratio, as shown on the 5-Year Daily ratio chart below.
The following graph shows the percentages gained by the 3 Major Indices and 3 ETFs during the past 5 years.

The next graph shows the percentages gained by the 3 Major Indices and 3 ETFs year-to-date.

It’s evident that, during the 5-year period, the XLF has outperformed its European and Chinese Financial ETFs, on a percentage-gained basis. The $SPX has, not only outperformed the other 2 Major Indices, but also their 2 ETFs.
On a year-to-date percentage basis, China’s ETF has far outpaced the other 2 ETFs. The $SPX has outperformed the other 2 Major Indices, but has lagged behind all 3 ETFs, especially China’s ETF.
From this comparison, you can see that world money flow, while slowing in the U.S. Financial ETF this year, has accelerated, relatively-speaking, in the European and (especially) Chinese Financial ETFs.
Inasmuch as price levels on all three ratios are at or near major resistance, we’ll see which market traders favour going forward into year end and 2018. These charts are worth monitoring to gauge the strength or weakness of these countries’ financials. We may see a rotation of funds out of China’s financial markets (and, possibly, out of Europe if full transparency is made available as to their banks’ true vulnerability regarding accurate stress tests of capital requirements) and into the U.S., for example, as traders anticipate several interest rate hikes by the Fed (one this December and 2 or 3 next year).
