
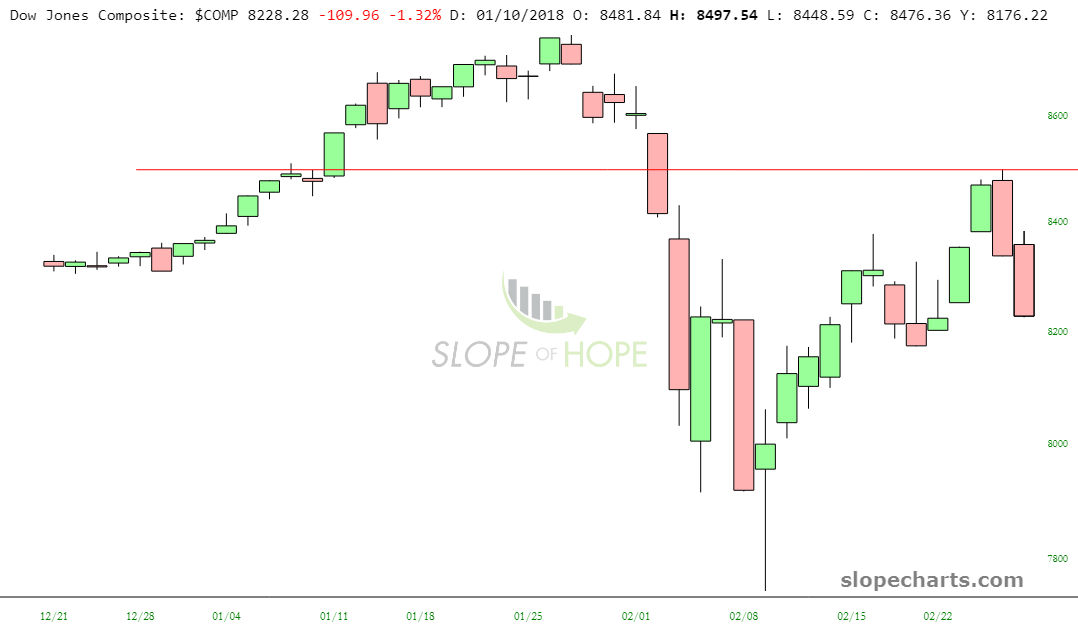
Well, this is the first down month we’ve had since President Courageous Super Business Guy Deal-Making Genius got elected. It’s almost impossible to believe, but we haven’t had a single down month since October 2016. This is also the biggest loss for a February since 2009. Needless to say, I’m pleased we’ve broken this streak. We can see quite plainly the top, the drop, the recovery, and – – God willing – – the resumption of weakness.
I’m starting to ask myself why I censor myself about Trump. I guess I want to focus on charts and not get distracted by politics. One guy wrote me this morning to compliment me on my (marvelous) Gartman post and said he’d stopped reading Slope since I was a fan of the “geriatric socialist” Bernie. I thought that was a silly reason to stop reading Slope, but there ya go. I’m not a socialist. I just am a fan of moral humans. I’m weird that way.
Slopers are a self-selecting group, and as such are ipso facto far more intelligent than the general public, as they’ve elected to be here in the first place. As such, I doubt I’d find many present fans of the administration, since the intelligentsia and his followers tend not to overlap on any given Venn diagram. I will simply state that it’ll be interesting to see where President I Would Have Run Into That School Building Even Without a Weapon lays the blame for the collapsing stock market as things unfold. I guarantee you, he won’t take the blame. That’s an easy bet.
Where was I? Oh, yeah. The drop in February. As thrilled as I am with the drop, let’s not get ahead of ourselves. The market is only down about 1% since the start of the year. Big fuckin’ deal. But I still had a good, solid month, and to be blunt, I’ve never been this short in my life. Not even close.
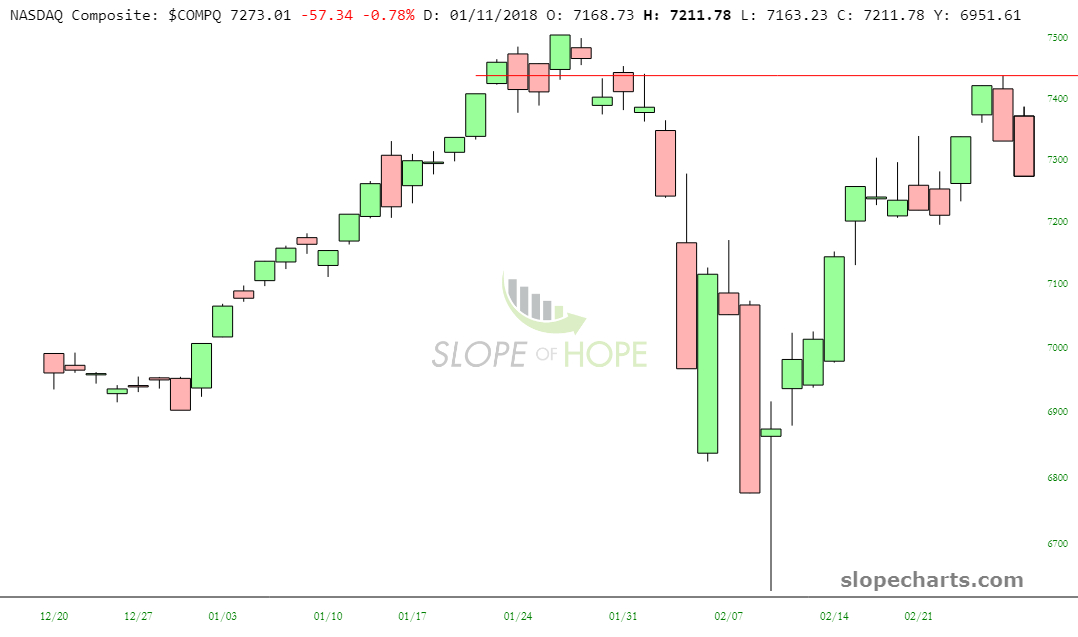
The NASDAQ has been more robust than other indexes. Until today, I didn’t really screw around with anything NASDAQ-ish, but I will mention as an aside that I did buy a buttload of August 2018 in-the-money puts on SMH (the semiconductor fund) at a very good price.
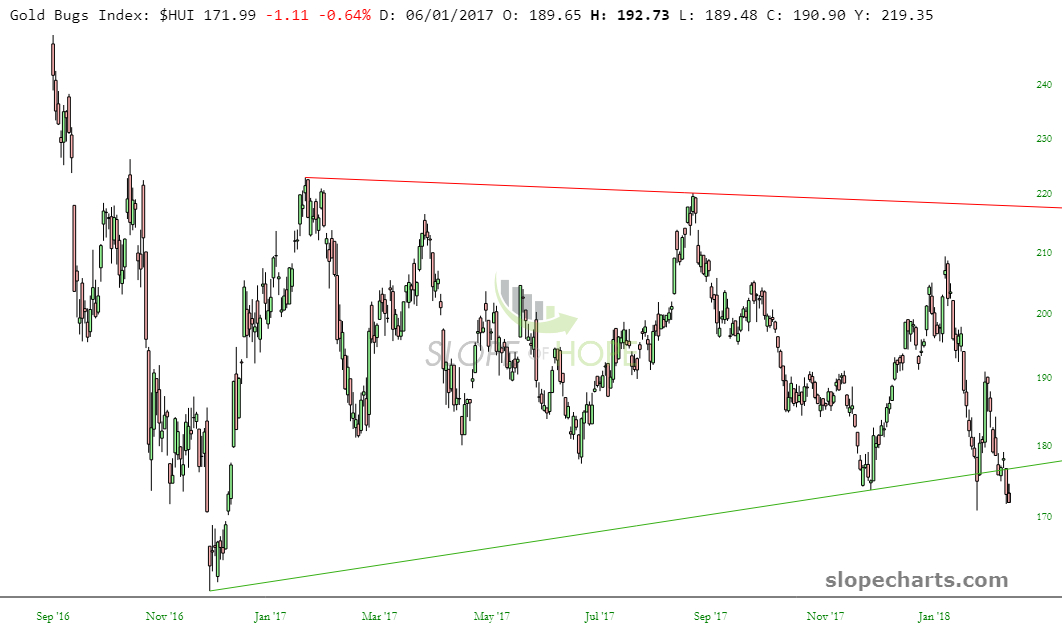
I haven’t messed with precious metals in a while, but I would also mention (as an aside) I think gold bugs could be in trouble. The Gold Bugs Index, shown below, has broken a fairly well-formed triangle pattern.
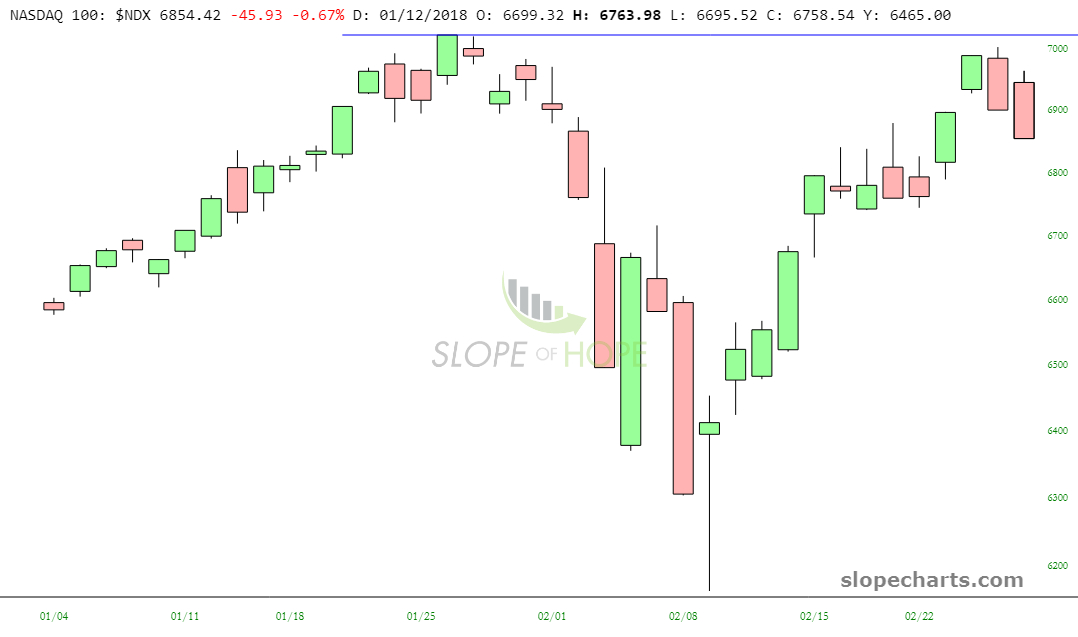
As I said above, the NASDAQ has been strong, and the 100 has been particularly Herculean, thanks to such insanity as AMZN. I’m going to call this one a double-top.
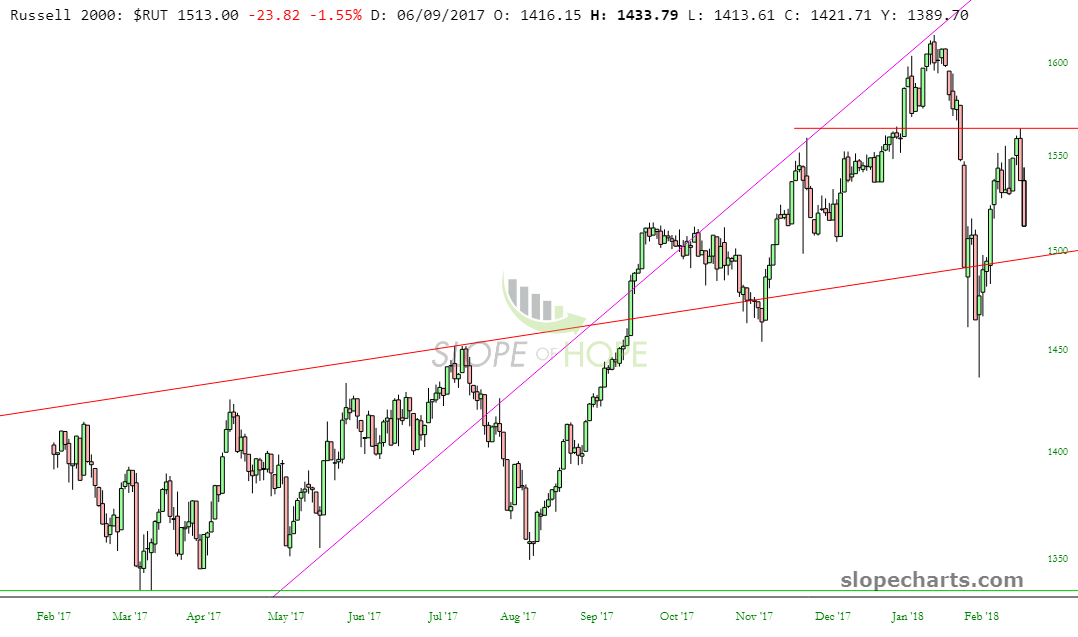
Of far more interest to me has been the Russell 2000, against which I have June 2018 in-the-money puts. These are profitable, but I have far more ambitious goals for this critter (that is to say, far lower prices on the index) before I sell ’em.
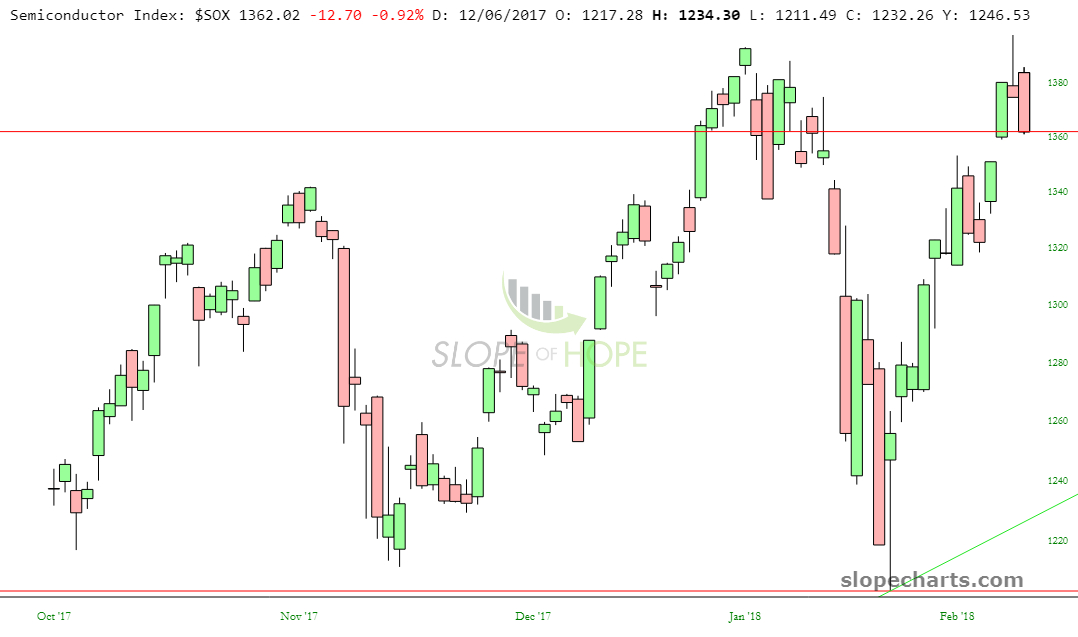
I mentioned the semiconductor fund above, so I wanted to share this chart of the index itself. I bought August 2018 puts against SMH, and the chart of the index itself below shows yesterday’s shooting star as well as today’s bearish engulfing pattern.
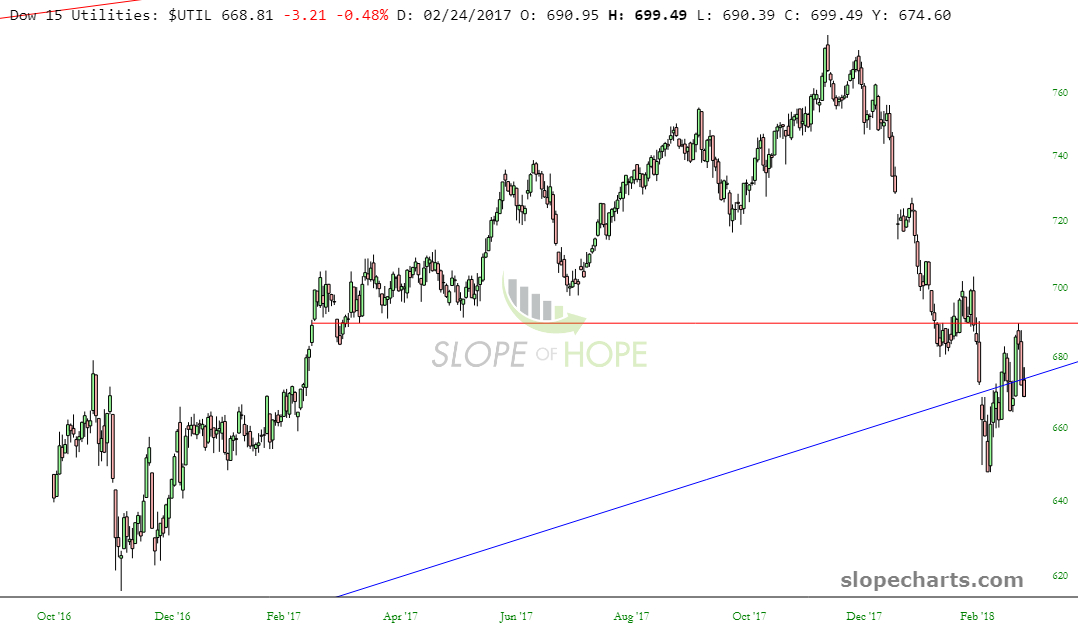
The Dow Utilities are particularly vulnerable and, I believe, will help drag us all lower.
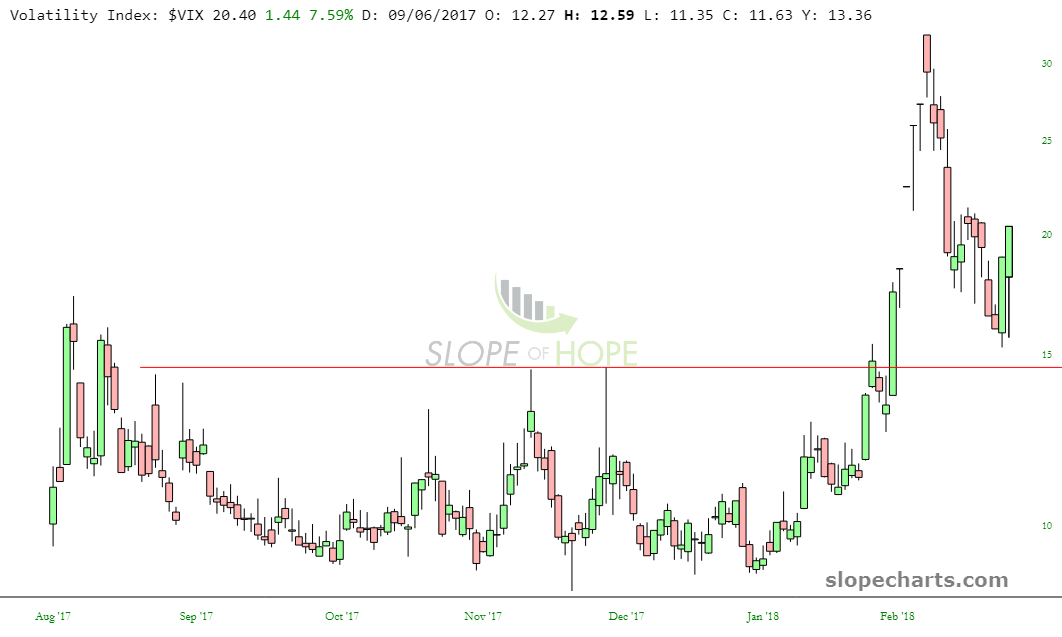
And the VIX, which had been at a laughable value of 8 only weeks ago, roared to the 40s, got smashed down to 15, and is strengthening again. Looks like a pretty clean saucer pattern to me, wouldn’t you agree? Volatility returns!
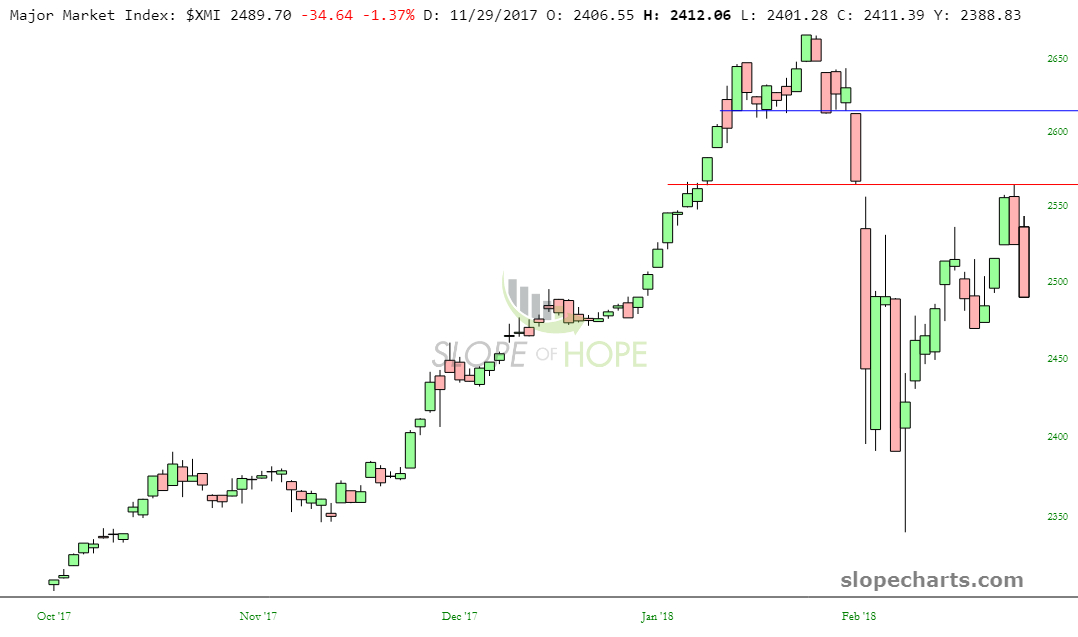
The Major Market Index illustrates nicely the “exhaustion” I think this last bounce has experienced.
Anyway, February was terrific, but as my PLUS readers know, I’ve got some crazy ideas about what March may hold. I’m excited. Now go to SlopeCharts and find some new opportunities!
