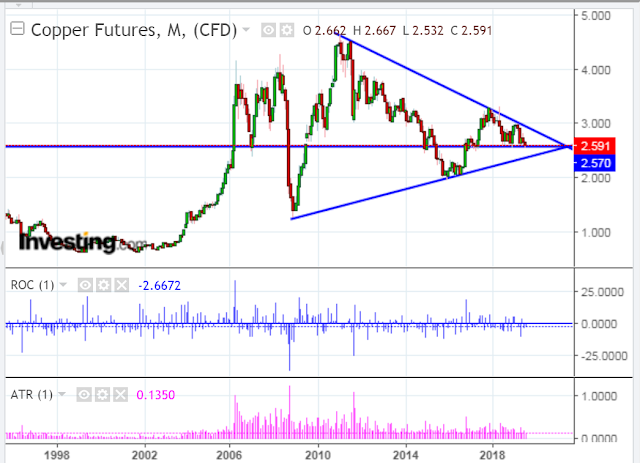
The following monthly chart of Copper shows that price is hovering above the apex of a very large long-term triangle.
Since early 2018, it hasn’t been able to break out above the upper edge of this triangle, confirming the weakness that we’ve been seeing in global markets, to date. My last article summarizes this weakness in a nutshell.
I’ve shown the Rate-of-Change (ROC) and Average True Range (ATR) indicators in histogram format with an input value of one period. I’d watch for a series of larger spikes on each to signal, either serious and sustained buying, or a plunge to further lows (as another gauge to track global market strength/weakness). Otherwise, continued smaller spikes would accompany more range-bound, tepid trading in Copper, as well as global markets, in general.