By Date

April 2024
slopechart_NXE.jpg
slopechart_BASE.jpg
slopechart_AA.jpg
March 2024
slopechart_(XLK+XLC+XLY)/(XLU+XLP+XLV).jpg
slopechart_QQQ/IWM.jpg
slopechart_$DOGE.jpg
February 2024
slopechart_TUA.jpg
slopechart_META.jpg
slopechart_AAPL.jpg
January 2024
slopechart_DG.jpg
slopechart_UNH.jpg
slopechart_EQIX.jpg
December 2023
slopechart_ADM.jpg
slopechart_ABR.jpg
slopechart_$SPX.jpg
November 2023
HP.jpg
bfm646B.jpg (937×505)
slopechart_GME.jpg
October 2023
slopechart_CLX.jpg
slopechart_CLX.jpg
slopechart_AVGO.jpg
September 2023
slopechart_$DJUSST.jpg
slopechart_IWM.jpg
slopechart_$VALUG.jpg
August 2023
slopechart_CCJ.jpg
bfm5ED7.jpg (922×642)
household debt service payments.jpg (1280×720)
July 2023
CBO debt forecast 2.15.2023_6.jpg (1191×670)
slopechart_SMCI.jpg
slopechart_META.jpg
June 2023
SoybeanOil.jpg
spx hit rate.jpg (864×657)
slopechart_$ETH.jpg
May 2023
bfm5A47_1.jpg (941×563)
bfmA1C8.jpg (941×565)
4f43962f7b273a22a24c16729a2c9d4c.png (755×355)
April 2023
slopechart_$SPX.jpg
slopechart_HUN.jpg
slopechart_HELE.jpg
March 2023
slopechart_AU.jpg
slopechart_META.jpg
slopechart_GDXJ.jpg
February 2023
slopechart_$XTZ.jpg
US stock market leadership: semiconductor stocks, tech stocks, broad market stocks (SMH, QQQ, SPY)
slopechart_BBBY.jpg
January 2023
slopechart_WELL.jpg
Time to stare at the long-term Uranium price | Notes From the Rabbit Hole
slopechart_$DXY.jpg
December 2022
uxtthjvu3a9a1.jpg (640×606)
soybean futures
tsx Venture index, TSX-V
November 2022
slopechart_RBLX.jpg
zcm00s7wlq2a1.jpg (960×625)
chart8.png (517×384)
October 2022
slopechart_$SPX.jpg
slopechart_$DOGE.jpg
2022-10-31_11-26-12.jpg (958×658)
September 2022
qtrly performance.jpg (1268×636)
unnamed (4)_560.png (1280×759)
unnamed (7)_496.png (803×513)
August 2022
slopechart_SPY.jpg
slopechart_HSIC.jpg
slopechart_/GC.jpg
July 2022
biden approval rating gallup.jpg (812×447)
slopechart_$BTC.jpg
slopechart_$ETH.jpg
June 2022
2022-06-30_11-59-47.jpg (1077×709)
2022-06-30_10-35-03.jpg (1080×699)
2022-06-30_11-55-36.jpg (1080×709)
May 2022
fredgraph.png (700×718)
slopechart_$BTC.jpg
slopechart_$ETH.jpg
April 2022
slopechart_$BTC.jpg
slopechart_$SHIB.jpg
slopechart_$SAND.jpg
March 2022
slopechart_PATH.jpg
fredgraph.png (770×620)
fredgraph.png (700×918)
February 2022
slopechart_PXD.jpg
slopechart_$BTC.jpg
slopechart_EPAM.jpg
January 2022
slopechart_CLF.jpg
slopechart_UVXY.jpg
2022-01-31_07-55-01.jpg (993×561)
December 2021
2021-12-31_10-46-56.jpg (1280×920)
2021-12-31_10-48-40.jpg (1280×640)
2021-12-27_7-07-15_1.jpg (1169×842)
November 2021
slopechart_$SPX.jpg
fredgraph.png (700×718)
October 2021
slopechart_IWM,TLT.jpg
slopechart_BB.jpg
fists.png (636×341)
September 2021
bfmC1C3_0.jpg (1015×570)
bfm98FC.jpg (1015×570)
bfm11BF.jpg (1015×569)
August 2021
fredgraph.png (700×718)
slopechart_PROG.jpg
2021-08-30 (2).png (1158×675)
July 2021
56977-fig2_deficit-interest-vs.png (825×352)
slopechart_ALLY.jpg
august worst seasonals_0.jpg (694×499)
June 2021
slopechart_$OEX.jpg
slopechart_XHB.jpg
2_24.jpg (624×521)
May 2021
slopechart_ZM.jpg
slopechart_$BTC.jpg
energy-1800-2020a.png (550×388)
April 2021
slopechart_TWTR.jpg
slopechart_RBLX.jpg
slopechart_NOK.jpg
March 2021
fredgraph.png (700×718)
fredgraph.png (968×770)
slopechart_PK.jpg
February 2021
RRG_MRO,USO,XOM.jpg
2021-02-27_11-01-35.jpg (622×354)
slopechart_SPY.jpg
January 2021
slopechart_ESPR.jpg
slopechart_LABD.jpg
slopechart_$BTC.jpg
December 2020
bfm75A_0.jpg (988×541)
bfm1E14.jpg (988×540)
slopechart_IDN.jpg
November 2020
slopechart_GDX.jpg
slopechart_GOLD.jpg
slopechart_RKDA.jpg
October 2020
slopechart_IP.jpg
slopechart_MO.jpg
slopechart_MO.jpg
September 2020
slopechart_METC.jpg
slopechart_GRWG.jpg
slopechart_CRM.jpg
August 2020
slopechart_SEE.jpg
slopechart_PALL.jpg
-1x-1 (1)_3.png (878×536)
July 2020
slopechart_TGT.jpg
slopechart_ECL.jpg
slopechart_CHD.jpg
June 2020
slopechart_UPS.jpg
slopechart_JBHT.jpg
slopechart_$OEX.jpg
May 2020
slopechart_TDG.jpg
who owns central banks_0.png (973×683)
BOJ owns 80% of ETFs.jpg (1158×817)
April 2020
Japan-national-debt
slopechart_XME.jpg
slopechart_/NQ.jpg
March 2020
SOAP_SPY.jpg
slopechart_AXP.jpg
slopechart_GS.jpg
February 2020
slopechart_AOS.jpg
slopechart_WELL.jpg
slopechart_ZM.jpg
January 2020
hui
hui
hui
December 2019
slopechart_SDC.jpg
slopechart_HDGE.jpg
copper
November 2019
slopechart_AZO.jpg
slopechart_NEON.jpg
slopechart_VCEL.jpg
October 2019
wage-inequality12-17_1.jpg (548×457)
income-real-quintile7-17a_0.png (550×426)
2019-10-31_8-14-53.jpg (1280×622)
September 2019
IBD-gdx-breaking-support-of-head-and-shoulders-pattern-sept-30.jpg (1864×917)
slopechart_BA.jpg
Chart of the day – Trading Channels
August 2019
Infographic: Americans Spent Nearly $150 Billion On Illegal Drugs In 2016 | Statista
slopechart_CLB.jpg
MW-GO827_sept_d_ZH_20180823094505.jpg (890×501)
July 2019
OMB projections.jpg (1105×783)
interest payment.jpg (722×462)
2019-07-31_7-23-41.jpg (1037×624)
June 2019
tax rates q1 2019.jpg (673×472)
EPS revisions.jpg (679×448)
slopechart_$BTC,NVDA.jpg
May 2019
My Dream Trading Tools Are Almost Automated! – Technical Traders Ltd.
Adaptive Price Modeling Suggests Big Rotation In US Dow Stocks – Technical Traders Ltd.
s3.amazonaws.com/cdn2.soci..._vsIDKV_l.png
April 2019
wtiH6log
coffee-about-to-heat-up-april-29.jpg (1569×730)
wilshire-5000-topping-pattern-similar-to-2000-possible-april-30.jpg (1567×728)
March 2019
slopechart_AZO.jpg
Proprietary Cycles Predict July Turning Point for Stock Market – Technical Traders Ltd.
Chart of the day – Trading Channels
February 2019
slopechart_FB.jpg
slopechart_NFLX.jpg
Chart of the day – Trading Channels
January 2019
Chart of the day – Trading Channels
2019-01-31_10-52-44.jpg (754×500)
2019-01-31_11-49-18.jpg (890×615)
December 2018
slopechart_SPY.jpg
1 Dec30.PNG
Chart of the day – Trading Channels
November 2018
slopechart_SKX.jpg
joe-friday-5-year-yields-bearis-doji-start-topping-pattern-at-20-year-resistance-nov-30-1.jpg (1577×735)
crude-oil-implosion-going-to-impact-texas-again-nov-30-1.jpg (1571×733)
October 2018
1 (2700×1518)
slopechart_SO.jpg
slopechart_$BTC.jpg
September 2018
China PMIs.jpg (512×317)
FT_18.09.20_DigitalTechUse.png (640×530)
slopechart_VMC.jpg
August 2018
slopechart_AAPL.jpg
Nasdaq Surges To Best August Since 2000, Bonds Bid As EM Collapses | Zero Hedge
14 aug31.png
July 2018
2 aug1.PNG
1 aug1.PNG
Chart of the day – Trading Channels
June 2018
cbo-june-1_thumb.png (692×531)
2018-06-29_9-17-35.jpg (890×473)
hong kong centaline.jpg (890×405)
May 2018
Chart of the day – Trading Channels
slopechart_XLF.jpg
slopechart_$BTC.jpg
April 2018
DcFCfqbU8AA5EbL.jpg (598×446)
http://www.tradegato.com/gallery/albums/TradeGato/VolumeNatrix-04_30_18.png
esH1log.png
March 2018
2 mar31.PNG
slopechart_DXJ.jpg
1 mar11.PNG
February 2018
Most Popular Exercise Activities in the US | Fitness-Equipment-Source.com
Natural Gas has Surpassed Coal as US's Leading Source of Electricity [OC] : dataisbeautiful
eurH4log.png
January 2018
slopechart_FOXA.jpg
slopechart_FOXA.jpg
slopechart_FOXA.jpg
December 2017
Fatal-Accidents-Per-Year-1946-2017-1.jpg (1300×650)
4 dec31.PNG
3 dec31.PNG
November 2017
putcallratio.png
goldH6log.png
http://tradegato.com/gallery/albums/TradeGato/YM-12-17-240-Minute-_-YM-12-17-1-Day-2017_11_30.png
October 2017
ngDlog.png
http://tradegato.com/gallery/albums/TradeGato/YM-12-17-240-Minute-_-YM-12-17-1-Day-2017_10_31.png
exxon-testing-breakout-level-oct-31.jpg (1261×675)
September 2017
gold-50-silver.JPG
qqq-testing-rising-wedge-support-with-lower-momentum-sept-28.jpg (1296×672)
silverH1log.png
August 2017
usdjpyshort.jpg
ngH4log.png
LTCperspective.jpg
July 2017
eurH6log.png
image.png
image.png
June 2017
cdn2.socialtrade.com/comsy..._XmMknS_m.png
BABA_BewareOfMyWife.png
Until The L-MLH Is Reached.png
May 2017
1 june1.PNG
IMG_9428.PNG
20170531_PMI.jpg (971×501)
April 2017
IMG_9197.PNG
goldH6log.png
wmc170501e.png
March 2017
C8Q1l2xVwAA3pou.jpg:large (1569×732)
20170331wins.png
xle-spy-ratio-testing-dual-support-march-30.jpg (1296×673)
February 2017
crude-oil-kissing-underside-of-resistance-for-weeks-with-crude-feal-low-feb-28-1.jpg (1568×733)
eurH1log.png
How Americans Over 70 Spend Their Day – Data Visualisations
January 2017
Hussman-price-sales-ratio-Jan-17.jpg (600×507)
rutH4log.png
20170131_macro.jpg (946×486)
December 2016
20170101_GOLD.png
20170101_oil.png
20170101_DumbToSmart.png
November 2016
gold-dollar-ratio-testing-important-support-nov-30.jpg (1573×733)
IMG_8206.PNG
eurH1log.png
October 2016
VXX.jpg
eurH4log.png
ES_10-31-16.PNG
September 2016
009 namo.png
009 bpnya.png
SI_9-30-16.PNG
August 2016
20160901_usd.png
20160901_oil.png
rutH8log.png
July 2016
paldf2.png
paldf.png
palladium.png
June 2016
Untitled.png
10-Year Bond Price - Weekly - 6.30.16.png
crude-oil-nyse-facing-resistance-june-30.jpg (1175×684)
May 2016
Vancouver Real Estate Unaffordability
oil 31.05.16.png
160530 - SPX 100 MA deviation.jpg
April 2016
USD_rally_coming.png
GLD42916.jpg
bpspx49.png (1964×1036)
March 2016
VXN QQQ 2 hoursc.png
20160330_wallmain.jpg (969×504)
DDD 30.03.16.png
February 2016
original.jpg (1143×1027)
zerohedge.com/sites/defaul...28_japan1.jpg
SP500-MarketUpdate-1-022616.png (900×666)
January 2016
zerohedge.com/sites/defaul...ws%20citi.jpg
SPX12916.jpg
bip.png
December 2015
20151231_2015.jpg (1152×627)
SPX123115.jpg
coffee.png
November 2015
spy 5 day range leading to short term weakness.JPG
GDP-wages8-15a.png (550×442)
declining-wages.png (534×508)
October 2015
CSrWhjtVEAEi8-3.png:large (1023×721)
content.screencast.com/use...SPX103115.jpg
image.jpg
September 2015
zn.jpg
COF-JPM 2015-09-29-TOS_CHARTS.png
LOONIEjpg.jpg
August 2015
Tran and Indu Birdie Crosses - Dow theory.PNG
image.jpg
image.jpg
July 2015
Canadian Export-Import Prices, Corporate Profits, GDP & Savings Rate
2015-07-31-PROPHET.png
spx7-29-15.png (550×551)
June 2015
deaths.png (3088×2018)
junkbondpimcotestingsupportjune30.jpg (1571×731)
dollarformingbearishdescendingtrianglepatternjune29.jpg (1574×740)
May 2015
http://content.screencast.com/users/Jim_Nf6/folders/Jing/media/0b1af74f-34b9-4b7b-9b3e-eacf5f42ad2c/2015-05-31_1013.png
The Weekly Markets Analysis - 31/5/15 - Grexit?... • The Market Zone
Titan
April 2015
gdxj04302015.png
hedj
ibex.dax
March 2015
How The Fed Has Failed The Nation (In One Chart) | Zero Hedge
sc308.png
UHNW 1.jpg (1368×881)
February 2015
announcements of stock buybacks.jpg (866×586)
copperchannelsupportfewbullsfeb261.jpg (1570×733)
nascompfinalfeb27.jpg (1034×705)
January 2015
http://content.screencast.com/users/Jim_Nf6/folders/Jing/media/721b20e8-75f8-4ff3-9495-51b0eb4ab703/2015-01-31_1908.png
20150129_odd.jpg (962×504)
ZOES.png
December 2014
Hugh Hendry's Eclectica Fund has had a great Q4 (up 3.3%, 4.0%, and 5.0% in the last 3 months) despite portfolio risk being quadruple his 'old normal'. How did he achieve this? He begins... "There are times when an investor has no cho...
commoditytrainwreckcontinuedec31.jpg (1228×686)
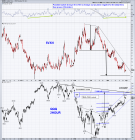
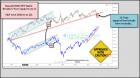
Canadian Real Estate, the Black Swan and the Russian Bear 
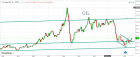
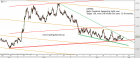
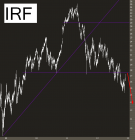
The Slope upload app does not want to grab the chart of USD:CAD & Oil Index. Click to view the big mov...
November 2014
crude option futures already active.png
crude futures.png
The Market Zone — Weekly Markets Analysis - 30/11/14
October 2014
content.screencast.com/use...RUT103114.jpg
hh.jpg
content.screencast.com/use...son103114.jpg
September 2014
Trading channels: Euro how far down
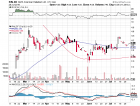
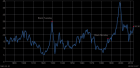
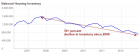
The U.S. Case-Shiller 20 City Composite housing data to July 2014 were released and looking at the M/M and Y/Y charts it's easy to see that seasonal buying has agai...
gm
August 2014
euro.png
obama-smoking-weed-e1303336520108.jpg
0831-oldfix
July 2014
XHB weekly 7.31sc.png
original_25065502.jpg (1179×665)
dow_07312014.png
June 2014
Don't Ignore This Chart: RYDEX Bears Stay In Hibernation - Articles - StockCharts.com
The Stock Market's Seven-Year Itch | Zero Hedge
Mission Accomplished | Zero Hedge
May 2014
2014-05-31_1453 - BDI's library
2014-05-31_1432 - BDI's library
s.wsj.net/public/resources...530154202.png
April 2014
Trading channels: Another pointless FOMC rally
spx 30 min.png
Picture
March 2014
SPX DAILY.png
Image
SPX MONTHLY.png
February 2014
content.screencast.com/use.../RUT22814.jpg
Mathematics or emotion?
QEGap3.png
January 2014
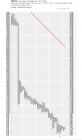
Channeling BDI : Coneheads all.
Picture
Kimble.jpg
December 2013
Picture
nor
Gold Scents: BEAR MARKET BOTTOMS: ONCE-IN-A-LIFETIME OPPORTUNITIES
November 2013
rut_daily.png
rut_monthly.png
A taste of this week’s WMA:
2 harmonic AB=CD patterns in $GOOG daily chart
October 2013
Trading channels: Ready for some downward action
USO DAILY.png
September 2013
es 60 min.png
spx 15 ED.png
Trading channels: Bombastic sugar
August 2013
ECM-Wave-2011-2020
Trading channels: Weekend post
July 2013
$NASI
$NYSI
Trading channels: Day of false breakouts
June 2013
es 30 min.png
AGQ daily.png
content.screencast.com/use...DJPY63013.gif
May 2013
CAT
$SPX
$NYSI
April 2013
FXE 2013.04.30 Gartley retrace.jpg
GDX 2013.04.30 Gartley retrace.jpg
AAPL 2013.04.30 RSI sell zone.jpg
March 2013
FXE
This Is What It Feels Like To Have Your Life Savings Confiscated By The Global EliteBy Michael, on March 29th, 2013What would you do if you woke up one day and discovered that the banksters had “legally” stolen about 80 percent of...
Cyprus Parliament President Says "No Future" Under Troika, Calls For "Iceland" Solution
February 2013
JY 30 MIN.png
ES 15 MIN.png
0228-fibs.png
January 2013
ES 15 MIN.png
Jesse's Café Américain: Jon Stewart: Chaos On Bullshit Mountain
us dollar
December 2012
us housing inventory
surplus deficit gnp
chart
November 2012
gold-mines-deposits-ranking-2012-infographic
1130-IRF
household-income-real-median-growth-since-2000.gif (911×662)
October 2012
20121031_job.jpg (718×382)
Financial Insights for the Eschaton: Deflation or Inflation? Make the Call Based on the 10-Year TSY Note
Guest Post: The Financial Super-Storm of 2013 | ZeroHedge
September 2012
EUR 30 MIN.png
beansreadytofall30percentagainsept17.gif (1570×723)
crudeoilpulling500lowersept261.gif (1575×729)
August 2012
content.screencast.com/use.../EEM83112.gif
$SPX
$NYSI
July 2012
http://www.zerohedge.com/sites/default/files/images/user5/imageroot/2012/07-2/Stock%20vs%20PB.jpg
http://www.zerohedge.com/sites/default/files/images/user3303/imageroot/2012/07-2/20120727_EUGame5.png
SPY July 31 divergence.jpg
June 2012
I didn’t originally intend to split this week’s letter into two parts but due to a special guest writer and the importance of getting to the crux of the eurozone debt crisis I have decided to focus today’s letter on Europe and Frid...
The following fascinating chart from Tableausoftware shows the history of US unemployment by state since 1976, and specifically the difference from historical averages. What the chart shows is that as more and more people have migrate...
While relaxing on a Saturday afternoon, doing some market related work, I thought I would pass this on to my fellow traders on The Slope.A while ago, I listened in on a video done by Tim? Bourquin who has interviewed hundreds of succ...
May 2012
Daily chart: China in your hand | The Economist
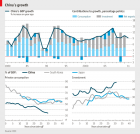
A brief guide to why China grows so fast
$NYSI