Popular - Today: CSIQ_Weekly_Jan262015.jpg
CSIQ_Weekly_Jan262015.jpg
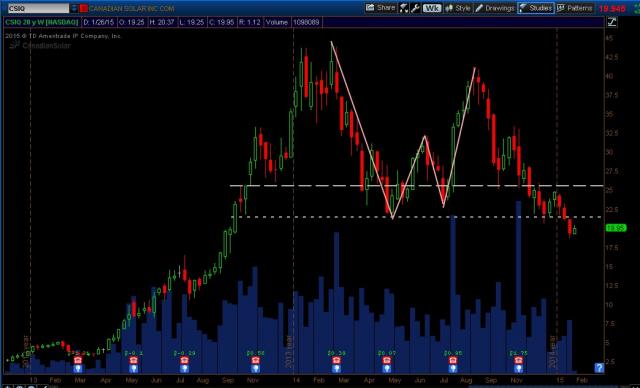
Canadian Solar weekly chart.
Nice "W" topping pattern, followed by a break beneath and close beneath prior structure support.
Also a nice solid downtrend since mid-September 2014.
Should CSIQ rally back up to $21.50 area, watch for daily time frame reversal lower signals.
Comments
No comments yet.

