Recent: 2015-01-17-FLEXIBLE_GRID_2.png
2015-01-17-FLEXIBLE_GRID_2.png
Here's a link to the chart if you are having problems seeing it through SocialTrade.
https://drive.google.com/file/d/0BwwAzGAwJFeHRkxLdTloMUhjR0U/view?usp=sharing
Here's a link to the chart if you are having problems seeing it through SocialTrade.
https://drive.google.com/file/d/0BwwAzGAwJFeHRkxLdTloMUhjR0U/view?usp=sharing
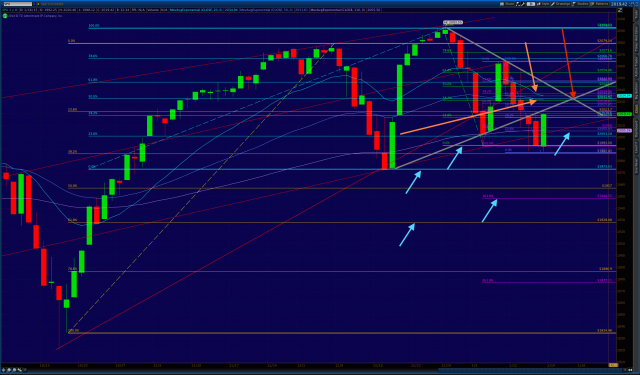


Then I took the trend lines from Closing Basis and added those which are shown in thick grey lines.
Finally I added the daily 20 EMA and the 50 EMA’s as pointed by the orange arrows.
The result is what I have dubbed the singularity, the red arrow, because not only of the confluence of technical analysis mumbo jumbo but that it also aligns with the ECB announcement on the 23rd of January where the two grey lines cross.
Also, there are two areas where the 5 Fib retracements are in a fuzzy alignment zone. The first is the 2019 level which we closed at Friday. The second is the 2034 level that aligns with the ECB announcement which getting there will not negate the current downtrend in play.
So we have the meeting of the 20 and 50 EMA’s, a confluence of 5 Fib retracements, and a crossing of two trend lines. Thats a lot of resistance. Which if the bulls can surmount, well that can’t be good for the bear case in the near term at least.
So I am imagine that this is where we will be by the announcement time. This is good place to go short if you believe we have another leg down. It will also be a good place for the bulls to see if the downtrend is over if we pick up the rising grey line as support.
Any thoughts appreciated and thanks to everyone for sharing their knowledge daily.
OK back to being a nuisance. 1/18/15