Source: stockcharts
Below are all items from stockcharts.

Public ChartLists | StockCharts.com
https://stockcharts.com/public/3267041


Edit Chart
For MM21 - just the default for correlation - it's been too long away from Stats class

Next Chart
Sludge

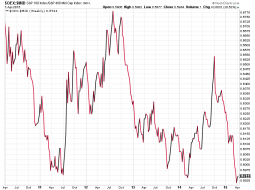
$SSEC
A closer look
1

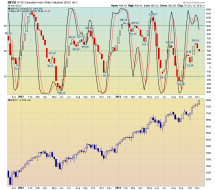
$SPX
Shanghai vs. S&P 500. When compared to the U.S., China doesn't look so hot.
3
DBB
Attn: Market Sniper: Metals certainly not signaling a market up move.

1

Edit Chart
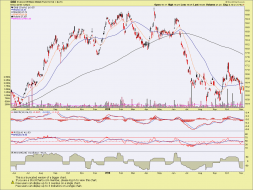
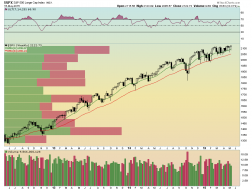
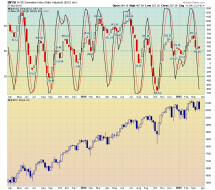
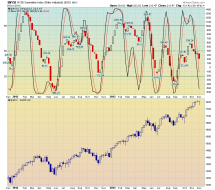
Homies make their way to key support equiv. of which is the SPX target (2100-2200).
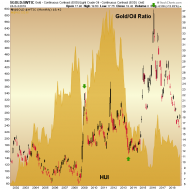
$GOLD:$WTIC
Gold/Oil Ratio (miner product vs. miner cost driver) is but one indication of historically low gold mining valuations...

sc (990×591)
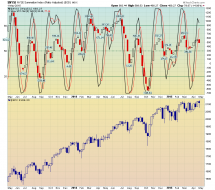
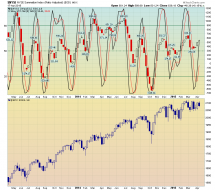
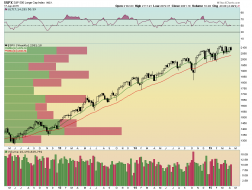
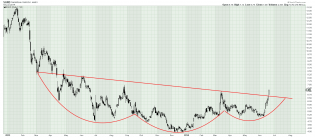
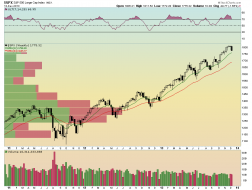
Three peaks and a domed house. Please, God, I hope so.
1

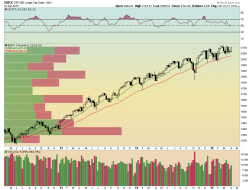
sc (990×591)
I simply love this graph
3

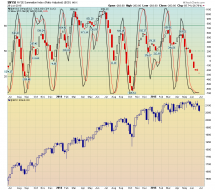
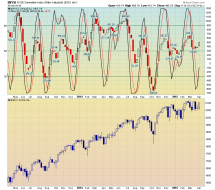
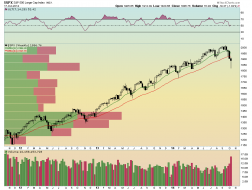
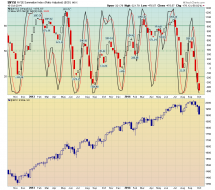
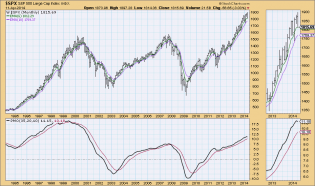
sc (930×707)
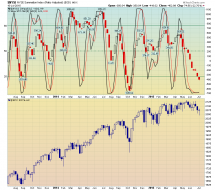
S&P 500 with PMO Indicator - - major crossover to the downside.
4

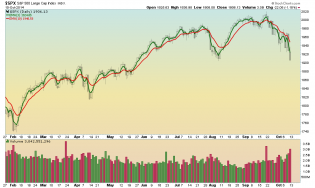
sc (990×591)
Check out the wild divergence between the U.S. stock markets and those of the top five ETFs

sc (990×897)
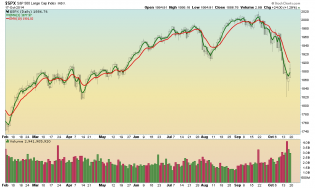
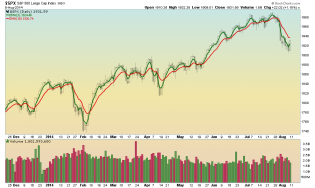
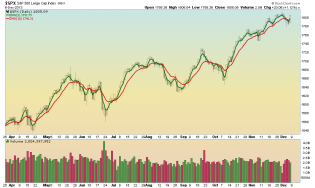
Weekly view of S&P 500 is horrifyingly bearish

sc (990×744)
Breadth rollover

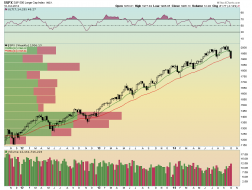
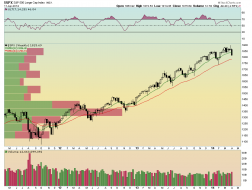
sc (990×591)
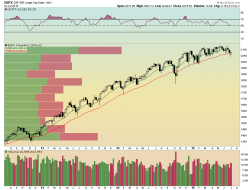
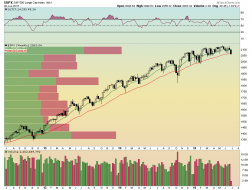
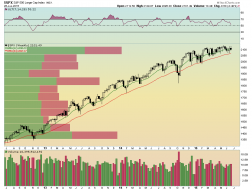
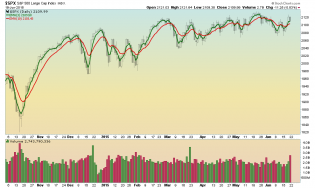
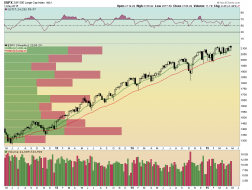
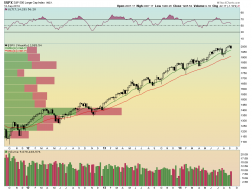
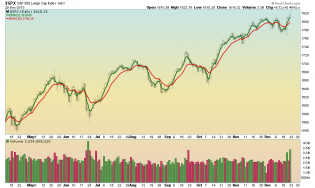
S&P with moving averages
1

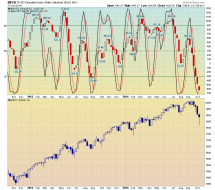
sc (990×897)
RSI Divergences Galore

$DJUSRR
Crazy Train
2
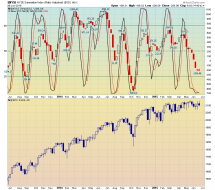
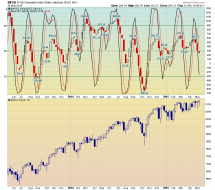
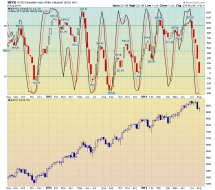
$NYSI
Breadth is oversold

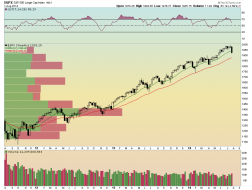
$SPX
SPX weekly is flirting with the 34 EMA
1
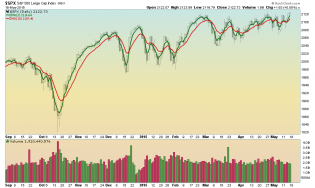
$SPX
Look! Below the 34 week EMA. For how long?
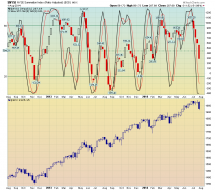
$NYSI
Oversold so maybe a bounce before getting lower
$SPX
We haven't reached the March/April low of around 2040 yet but it is a start. Will we make it in one thrust down or...
$SPX
Nothing to see here folks, move along
$NYSI
Buy signal coming
$SPX
Need to get below 2068-2072 to get out of the small range (get below 1972 and the Bears can start talking)
$SPX
$SPX weekly - a succession of higher lows.
1
$NYSI
$SPX weekly - flirting with a buy signal. Wait for it.
1
$SPX
$SPX daily. The market didn't violate it's previous low. This looks more bullish in late June than it did in late May.
1
$SPX
Short term trend is bullish but we're at the top of the range, doji on the daily, a breakout or stay within the range?
$NYSI
Weekly breadth is on a sell
1
$SPX
Weekly $SPX - persistent bull, hammers on the last two candles = more buying?
$SPX
Relentless
$NYSI
Sell signal coming?
$SPX
Stuck in the upper half of the 2040 to 2120 range

$SPX
SPX daily - Kapow
$NYSI
SPX weekly - NYSE Summation Index - still on a buy signal
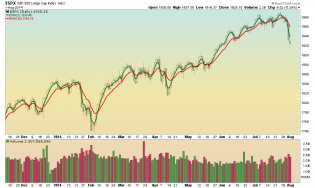
$SPX
SPX weekly = bullish trend intact, but note the lower weekly highs and higher weekly lows of late
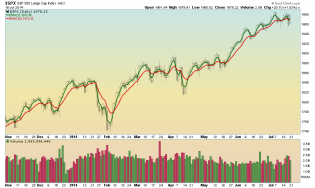
$SPX
SPX daily - short term trend is bullish
1
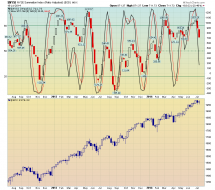
$NYSI
NYSE Summation Index weekly - buy signal
1
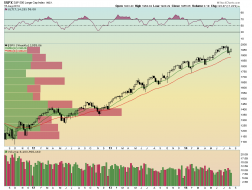
$SPX
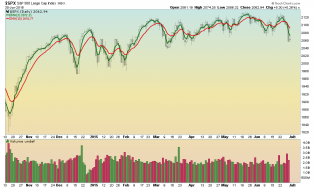
SPX weekly - long term trend is bullish
4
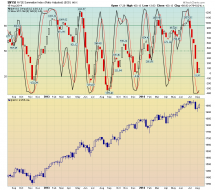
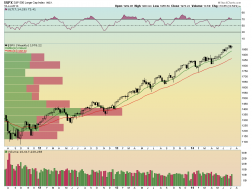
$OEX:$MID
Relative performance of the SP100 to the SP Midcap 400
1
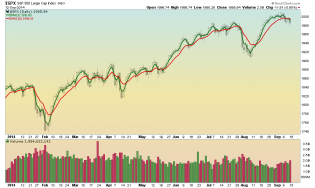
$SPX
SPX daily with 3 and 10 EMAs - short term sell signal
1
$NYSI
NYSI - Summation Index weekly - getting oversold
$SPX
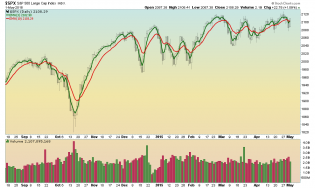
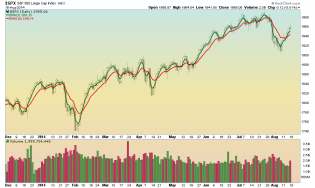
SPX weekly with 13 and 34 EMAs - still long term bullish. This isn't very sensitive to short term swings, see for...
1
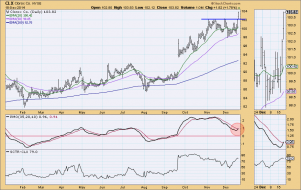
DecisionPoint: "Tracking" Investment Opportunities - Articles -...
CLX, nice long opportunity from DecisionPoint.

1
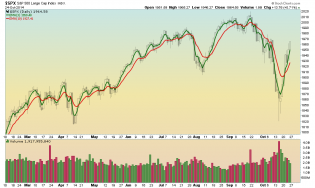
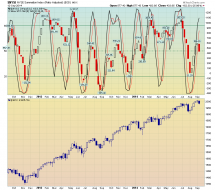
$SPX
SPX Daily - buy buy buy
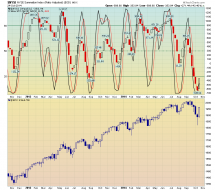
$NYSI
NYSI weekly - initial buy signal. It could form a complex bottom, but we shall soon see.
$SPX
SPX weekly - and the bull is back
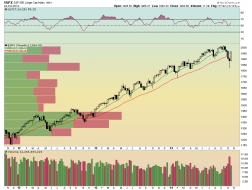
$SPX
Last two days have yet to recover to the 10 EMA
1
$NYSI
No buy signal yet
$SPX
2nd week below both EMAs - just look at that weekly candle! Bounce coming?
3
$SPX
SPX daily with 3 and 10 EMAs - knock, knock, knockin' on the August lows. I see lower highs.
$NYSI
Still on the sell signal
1
$SPX
SPPX weekly with 13 and 34 EMAs. Starting to get beary beary scary.
2

$DJW
Global Pain Ahead

Next Chart
Big discount for Christmas?
1
$SPX
SPX daily - 3,10 EMA crossover, bear sniffing?
$NYSI
SPX weekly with summation index - no short signal yet
$SPX
Weekly SPX - the bull is unrelenting.
1
$SPX
SPX daily - bullish
All three time frames indicate long
$NYSI
NYSE Summation Index - stochastic crossover - buy signal is imminent.
1
$SPX
SPX weekly - long term bullish - unchanged
$SPX
Short term trend is still bearish despite Friday's pop. I'm watching the April 4 high of 1897 and the May 13 high...
1
$NYSI
Wow, both stochastics are at 0. Once we have the crossover, we'll have a good signal to get long since this aligns...

$SPX
SPX weekly - still bullish since we aren't close to a MA crossover. We had a little "doji" week and it remains to...
2
$SPX
Long term trend remains intact (up, of course).
$NYSI
Intermediate term trends (breadth) is down, signal from 4 weeks ago was a good one.
1
$SPX
Short term trend is down (duh)
$SPX
$SPX weekly with 13 and 34 EMAs (7/18/14)
Nothing bearish here
1
$NYSI
$NYSI weekly (7/18/14)
Breadth has broken but this could signal consolidation instead of a down turn.
$SPX
$SPX daily with 3 and 10 EMAs (7/18/14)
Short term trend reversed in twice in two days. Let's see what happens...

Don't Ignore This Chart: RYDEX Bears Stay In Hibernation - Articles...
EXTREME sentiment readings
1

Next Chart
First of the Big Boys out of the penalty box?
SAND
Hope Indeed
1
Intermarket Analysis & Business Cycle Investing - David Calloway...
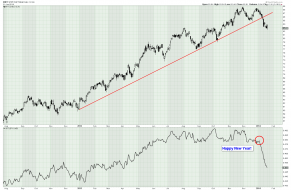
SPY Daily, ROC(250) is breaking the trend but is not negative.
from David Calloway
3

Intermarket Analysis & Business Cycle Investing - David Calloway...
avid Calloway chart.
Break in trend on the ROC(250) -early warning, it's not negative yet and the 100 EMA is no...
2
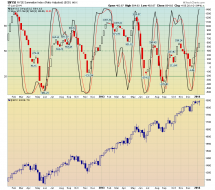
DecisionPoint Market Analysis Chart Gallery - StockCharts.com -...
From Carl Swenlin at Decision Point
3
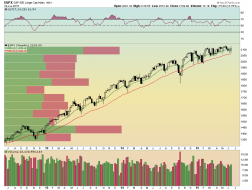
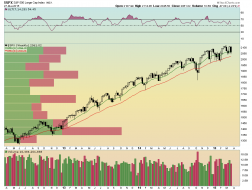
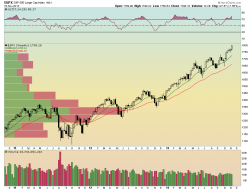
$SPX
SPX weekly
Gotta get down to the 34 week EMA
3
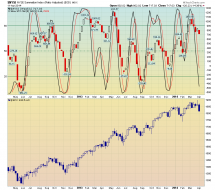
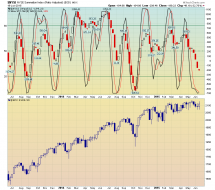
$NYSI
NYSE Summation Index weekly
More work to the downside to be done.
4
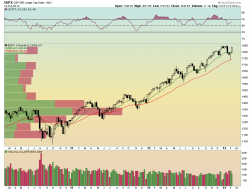
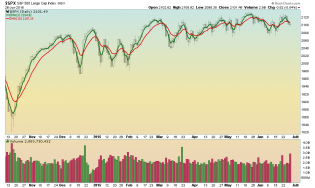
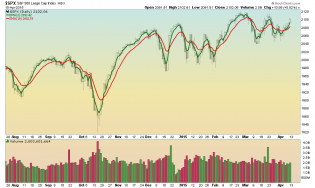
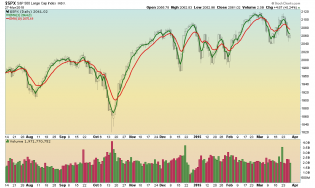
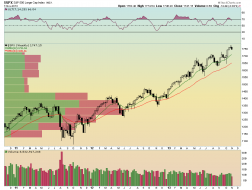
$SPX
SPX weekly with 13 and 34 EMAs (2/14/14)
Bounce of the 34 EMA
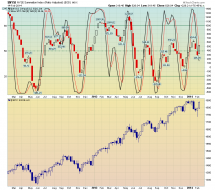
$NYSI
NYSE Summation Index weekly (2/14/14)
Despite the rise of the last two weeks, the stochastic indicator on bread...
1
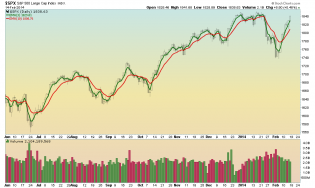
$SPX
SPX daily with 3 and 10 EMAs (2/14/14)
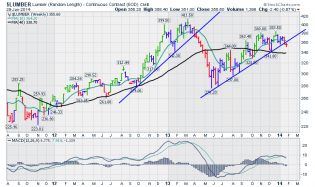
$LUMBER


ILF
50% exposure to Brazil
XRT
1
$NYSI
NYSE Summation Index 1/17/14
Short term overbought but we need to wait for alignment with the short term to consider...
1
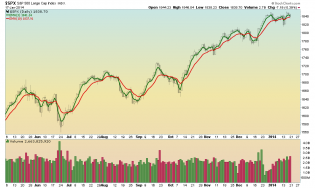
$SPX
SPX daily with 3 and 10 EMAs (1/17/14)
A new high - short term bull.
$SPX
SPX daily with 3 and 10 EMAs (12/20/13)
Yesterday's higher high has reestablished the short term uptrend.
1
$SPX
SPX weekly with 13 and 34 EMAs (12/13/13)
A nice black candle that breaks below the last two dojis. Is this an...
3
$SPX
SPX daily with 3 and 10 EMAs (12/6/13)
Cross down and cross back up
2
$NYSI
NYSE Summation Index weekly with slow stochastic (5,3) (12/6/13)
The sell signal from a few weeks ago has resulted...
2

$SPX
SPX weekly with 13 and 34 EMAs (12/6/2013)
A couple of dojis but no change in trend.

$SPX
SPX weekly with 13 and 34 EMAs (11/27/13)
Up, up and away!
1
$NYSI
NYSE Summation Index and slow stochastic (5,3) (11/27/13)
This past sell signal did not work.
$SPX
SPX daily with 3 and 10 EMAs (11/27/13)
We are 30 points above the most recent short term low.
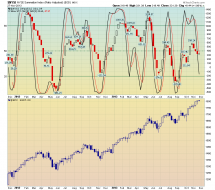
$NYSI
NYSE Summation Index daily with parabolic SAR (11/15/13)
The NASI has turned up, which is bad for bears.
1
$SPX
SPX daily with 3 and 10 EMAs (11/15/13)
Wow! My short term puts got killed last week.
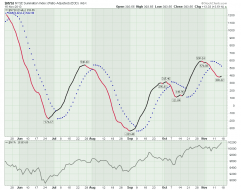
$NYSI
NYSE Summation Index with slow stochastic (5,3) (11/15/13)
Hope for the bearishly inclined - The NASI stochasti...
1
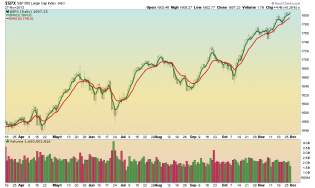
$SPX
SPX weekly with 13 and 34 EMAs (11/15/13)
This chart echoes Tim's post. Since May of 2012 we have not had more...
1
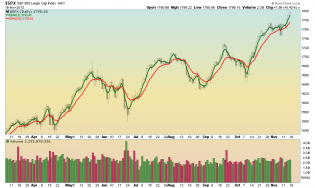
$SPX
SPX weekly with 13 and 34 EMAs (11/7/13)
We have a long way to go for the long term trend to begin turning dow...
1