Browse Stacks: Analytics: Elliott Wave
slopechart_$BTC.jpg
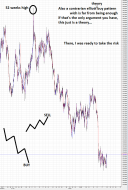
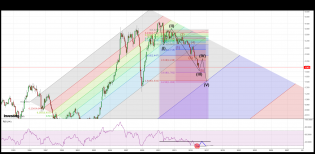
A more Prechter-esque Fib application. Last bull run was 15 months from halvening to peak mania. Saving for posterity.

1
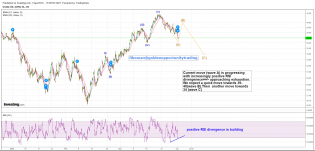
slopechart_$BTC.jpg
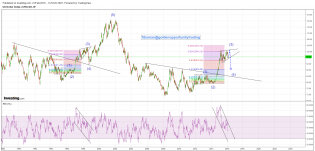
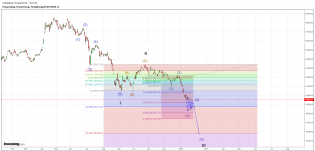
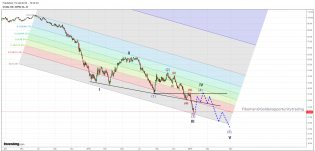
Updating my take on Bitcoin. Smashed through a lot of resistance last few months. Channel is 5 years old and containi...
3
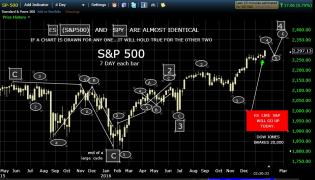
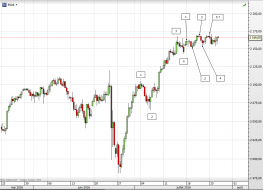
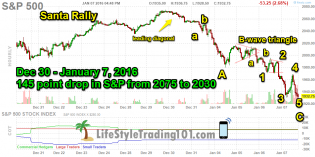
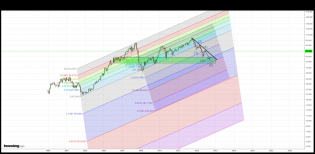
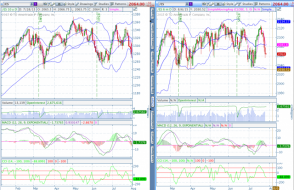
slopechart_$SPX.jpg
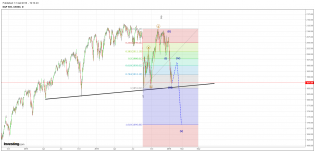
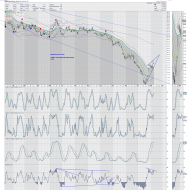
Following up on various commentary around here in the last week, up to and including a nice post by SB: Market flo...
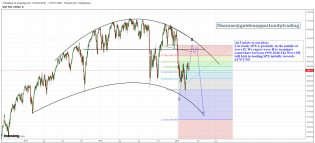
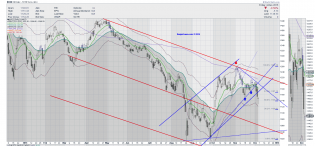
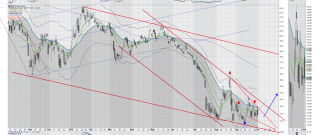
slopechart_$SPX.jpg
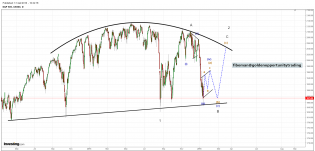
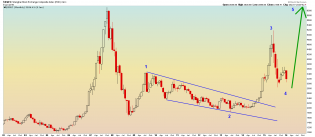
Updating a decorative wall hanging I made 18 months ago...
Page_20-01-17_11-14-08.png (1553×1021)
1

Cycle.gif

7 may18,.PNG

cdn2.socialtrade.com/comsy..._lnKwUG_m.jpg

cdn2.socialtrade.com/comsy..._TZ5Xb5_m.jpg
cdn2.socialtrade.com/comsy..._3s8Il4_m.jpg
1
cdn2.socialtrade.com/comsy..._Fnx70D_m.jpg
1
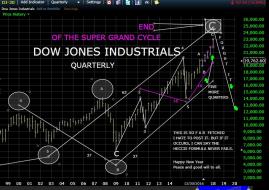
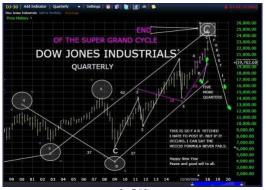
dow quart.JPG

5 feb25.PNG
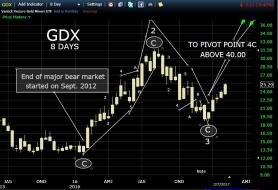
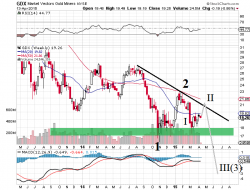
GDX.JPG
1
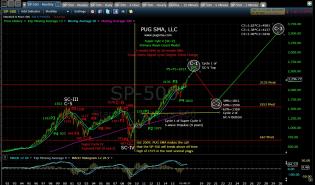
pug-sp-500-monthly-1-26-17.jpg (1476×870)
PUG's long-term view
1
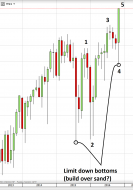
sand p.JPG
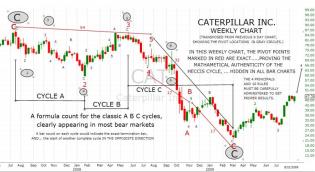
Cat Cat2.JPG
1
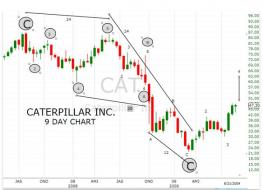
CAT CAT 1.JPG
1
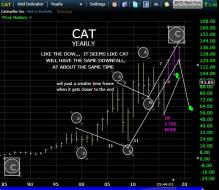
cat yr.JPG
1
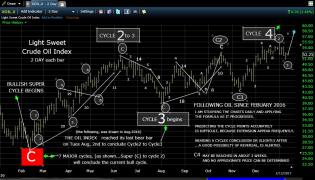
OIL.JPG
USD YR..JPG
USD.JPG
2
no 2.JPG
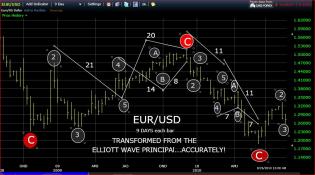
no 1.JPG
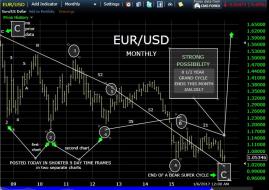
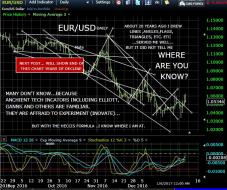
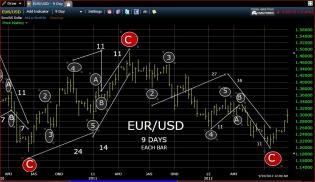
2 charts EUR/USD ,4 major cycles
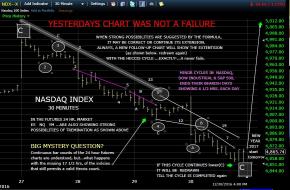
NDX 30 min.JPG
2
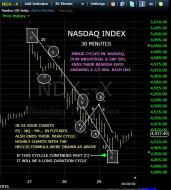
nasdaq 30 MIN.JPG
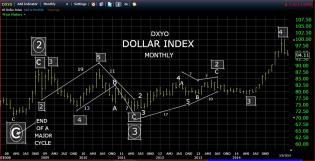
DOLLAR.JPG
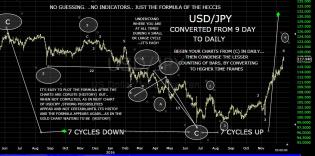
2 CHA USD JPY.JPG
1
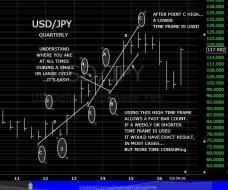
USD JPY QUARTERLY.JPG
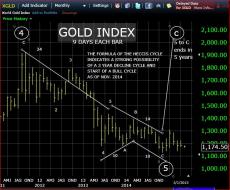
gold.JPG
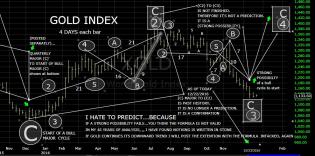
Gold 4 Day.JPG
1
4 nov27.PNG
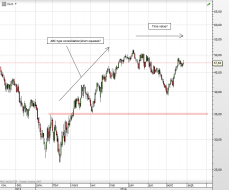
Dow industrials
1
4 oct18.PNG
Dec vol
5 sept28.PNG
Huuuum...
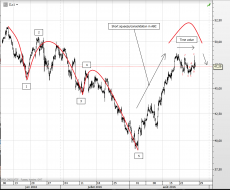
4 sept28.PNG
Possible Elliott wave convergence on december VIX
It's subjective, as always with Elliott!
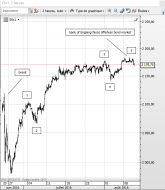
2 aug28.png
To me, going below the red zone again seems far from impossible at this point
If it happens that would make me th...
4
1 aug28.png
I think oil has topped and is ready for downside momentum again
Next week is certainly gonna be interesting!
2
5 aug10.PNG
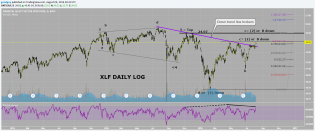
XLF DAILY LOG.png
This bear is still holding on. (at least for a little while longer). Here is a chart of XLF in where a down trend...

1
2 jul27.PNG
3
gold (60min) 29.05.16.png
Gold: A quick update

1
Real Estate IYR Weekly and Daily.png
I am still bearish on real estate. But after seeing the IWM correction as as EWT irregular flat (see recent postin...
2
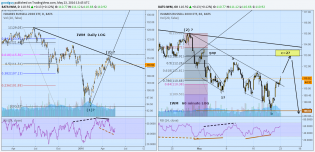
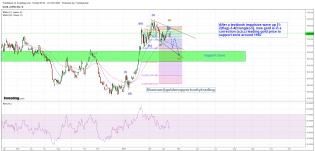
IWM Daily and 1 hour.png
Update on my posting of about 2 weeks ago. My target has stayed the same with a .62 correcion and possibly closing...
3
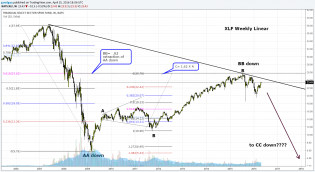
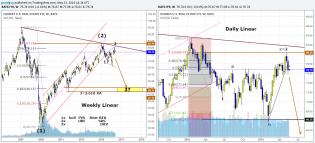
XLF Weekly Fib.png
XLF weekly linear Interesting Fibonacci relationships the way I see it. In EWT B waves not infrequently are tr...
1
XLF daily log..png
gold 16.04.16.png
Gold ongoing correction
1
spx 13.04.16 (2).png
1
crude 01.04.16.png
DDD 19.03.16.png
Long term bottom for 3D printers
crude 02.03.16.png
A follow up to our previous view
2
spx 24.02.16 (2).png
An Update to our plan
7
usdx 21.02.16.png
History may not repeat itself but it does rhyme
2
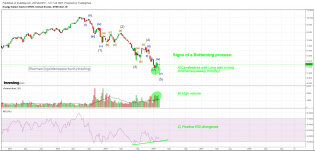
XLE 20.02.16.png
Energy Sector Equities (XLE): A buying opportunity
9
Weekly down with fan.png
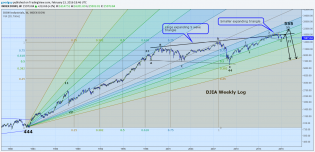
Dow Industrials Weekly LOG
Six months ago I published this chart thinking we were likely at THE top. The Dow Indu...
2
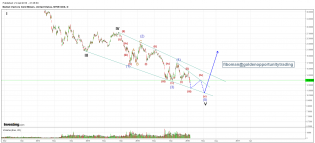
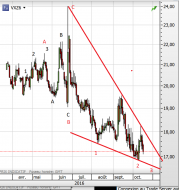
gdx 21.1.16.png
Simple math: (Ending diagonal)^2=upward explosion!
6

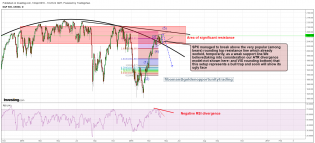
spx 21.1.16.png
the action by next week?
1
hang seng 16.1.16 (2).png
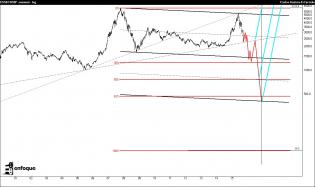
spx 17.1.16 (2).png
In case SPY breaks down very soon below NL the count would be
2
spx 17.1.16.png
4
oil 15.1.16 longterm2.png
Oil: Current long-term view-prediction 2
1
oil 15.1.16 long term1.png
Oil: Current long-term view-prediction 1
1
copper 12.1.16.png
Taking Copper down to CHINAtown
2
Natural.png
Second retracement wave of natural gas seems to be going in. Sorry, but I think UNG is headed towards the gap $8.0...

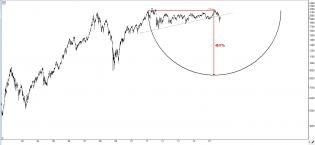
China Monthly - 1.11.16.png
China Monthly. This is an opinion.

9
010716.png

1
$XOI.png
I made a terrible bullish call about ten days ago on Energy. a vote by the United Kingdom for air-strikes coupled...
XLE.png
XLE is right now sitting just below support for a channel I thought began forming back in late August and uses the...
gc 251115.png
Gold's bottom on summer 2016
1
xle4.png
XLE heading lower
3
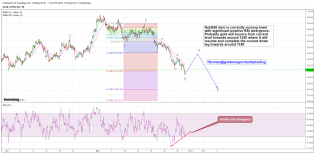
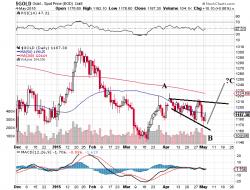
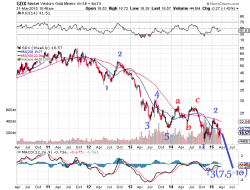
GDX.png
GDX appears to be currently in a large downward channel that started back in November and looks set to begin the t...
2
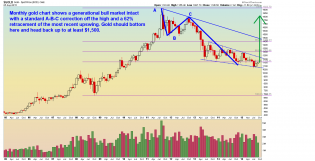
Monthly Gold.png
Monthly gold. (Obviously I misplaced the A-B-C, but I think people will get it). This is an opinion and not investmen...
1
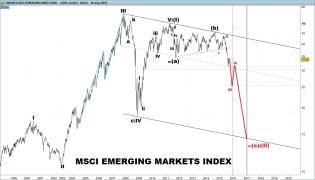
ISHARES MSCI EMERGING INDEX FUND.jpg
EMERGING MARKETS ELWAVE

1
SSECOMPII.jpg
SHANGAI SE COMPOSITE
1
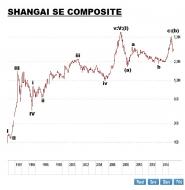
SSE.jpg
ASIAELWAVE- Shangai SE Composite
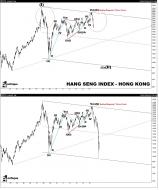
hangseng.jpg
ASIAELWAVE-HONG KONG
EKOSPI.jpg
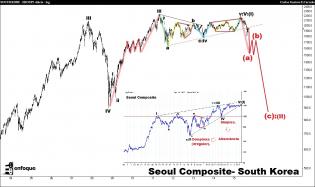
EKOS.jpg
ASIAELWAVE-South Korea
IBB_II.png
This may be wave three of a five wave descent. Biotech's are pinching into a very bearish rising wedge. Curious th...
SPX.png
A possible bearish rising wedge has emerged in the S&P (and elsewhere).
Dow monthly 2.png
Monthly log DJIA One last chart. Then I wont bother anyone again for a few months. I like this last chart as it f...
4
cdn.socialtrade.com/comsys..._rkHQ2B_m.png

sc321.png
Is Gold starting a Major Decline towards sub-1000$?
3
sc315.png
Gold in a descending broadening wedge pointing to 1250
1
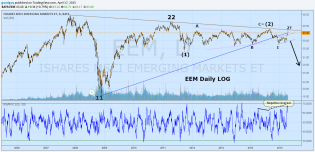
download.png
EEM Emerging markets Daily LOG: Short term the emerging markets are on a tear up. But from a longer perspective th...
sc311.png
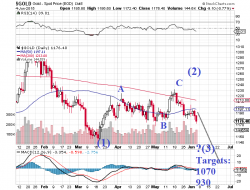
a possible very bearish count for GDX
1
sc308.png
An EW count leading GDX to oblivion...
1
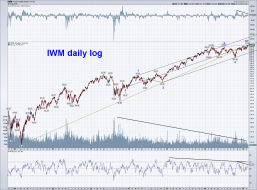
IWM daily log.png
Last Bear standing???? Before you trend followers (ie smart money making traders) make fun of this please note tha...
6
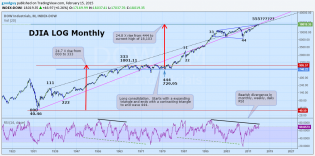
Dow In monthly.png
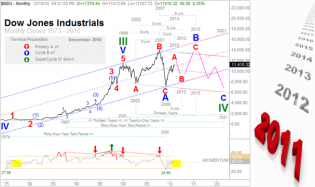
Is the Dow Industrials at a long term major top?
Of course no one really knows the answer to that but this chart...
Elliott Wave Technology. Automated Trading and Investment Strategie...
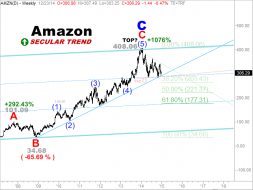
Are traders and investors about to dump Amazon?

3
Elliott Wave Technology. Automated Trading and Investment Strategie...
4
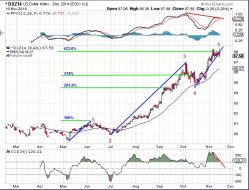
DX.jpg
Dollar (DX) 5 waves up to 423.6% since May. EUR (not shown) has completed 5 waves down to > 314% since May.

1
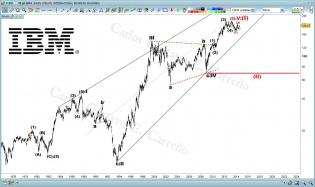
IBM.jpg
IBM-ELWAVE
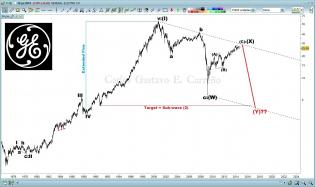
GENERALELETRIC.jpg
GE-ELWAVE
1
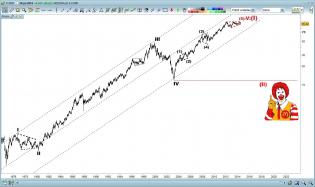
MCDONALDSi.jpg
MCDONALDS-ELWAVE
1
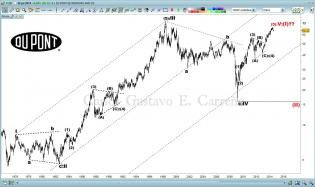
DUPONT.jpg
DUPONT-ELWAVE
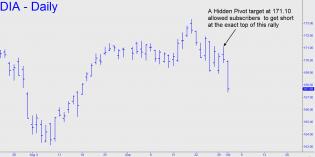
DIA-daily-Oct1.jpg
I’m tracking four Oct 10 167/169 put spreads for a 0.05 CREDIT, based on subscriber feedback left in the chat ro...

2
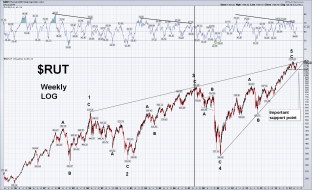
$RUT Weekly LOG 6.22.14.png
$RUT weekly log: This is a follow up a post I made on 10/18/13. At that time I said: "One pattern formation that...
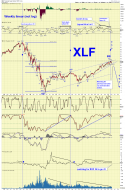
XLF weekly sc.png
Weekly XLF non-log chart: Is XLF set up for a fall? Always a dangerous call in this market. But the set up seems r...
2
NAS bank
XLF
