
Ammo, I like that volume profile chart you posted with the daily appearance.
It more clearly shows the head & shoulders topping pattern forming.
I just focused on a bunch of weekly charts Sunday to see what there was to see.
Browse Stacks: Analytics: FB_Weekly_May102015.jpg
FB_Weekly_May102015.jpg
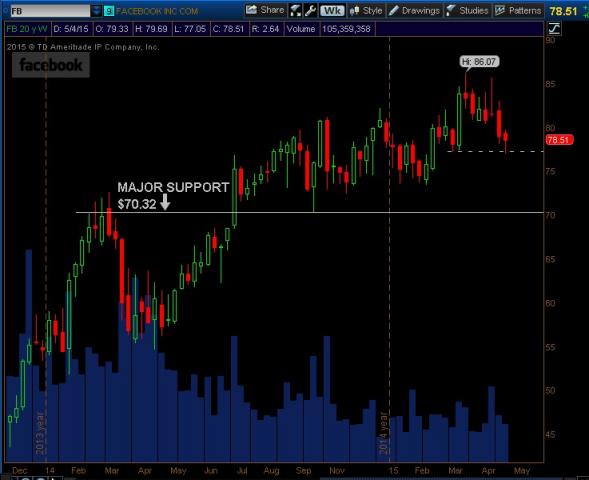
Facebook bounced off support from March on the weekly chart.
Should that area hold, we'd expect to see a move back up to re-test the all-time high.
Facebook is still bullish on the weekly/monthly timeframes, and has major support at $70.32


http://i.imgur.com/o8wl1D2.png