Browse Stacks: Analytics: COST_Weekly_vs_Daily_June092015.jpg
COST_Weekly_vs_Daily_June092015.jpg
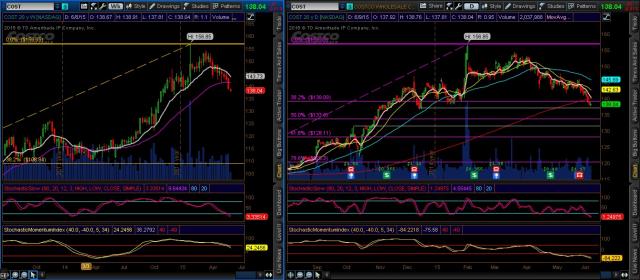
Optionable trade possibility for America's favorite big box chain, CostCo.
The close beneath 34-week EMA last week helped implied volatility rise in COST.
Looking at the daily chart, price traded and closed beneath the 200-day SMA for two consecutive days, before putting in a potential inverted hammer doji candle today.
Note on the daily that both the 12,3 Slow Stochastic and 34-period SMI show extreme bearish reading.
The IVR of COST as close of Tuesday is at 53%, offering decent premium to sell an option.
Initial support on the daily comes in at $137.
For the IRA/less aggressive, selling a put spread in July at strikes beneath 137 offers a decent risk-reward.
The more aggressive trader can sell the put outright if they have the capital.
Comments
No comments yet.

