Browse Stacks: Business: EURUSD_20yrWeekly_Fibs_Support.jpg

EURUSD_20yrWeekly_Fibs_Support.jpg

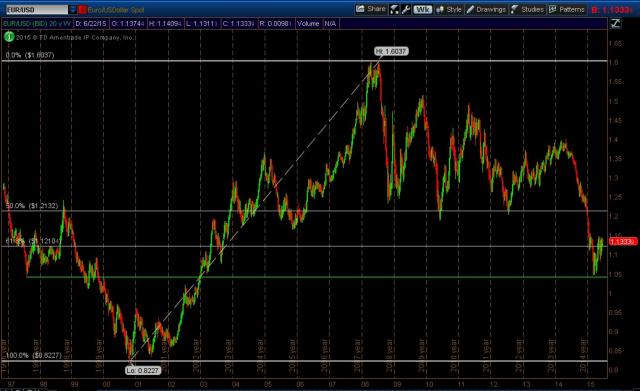
Updating the long-term picture on the EUR/USD 

Please note how a support level from August of 1997 (1.0414) has helped hold up the rainbow currency. 

My fellow fibonacci traders will also note this bounce came in-between the 61.8%-78.6% retracement zone of the currency's all-time low to all-time high. 

So in the larger timeframe value has been found (for now). Whether this means the EUR/USD will push higher over the next year or so is anyone's guess, but there are multiple points of (what should be) resistance above.

Comments

DinkDink
Would you be willing to do an experiment? Run an excel random number generator, come up with 3 random percentages between 0%-100% and use those as your new personal "Fibonacci" numbers in trading. Let me know of your results please. 6/22/15
moneymiser21moneymiser21
Dink, I don't use excel, nor would I need to reinvent the wheel. 
 
The 50-61.8% level is well established as the key zone to watch for fibonacci. 
 
They are not hard and fast lines, and not meant to be used by itself. 
 
Price action is the only indicator one really needs. Everything else is a derivative of price. Fibonacci is just a supporting tool. 6/23/15
...