Browse Stacks: Patterns: Inverse H&S: 12 sept9.PNG
12 sept9.PNG
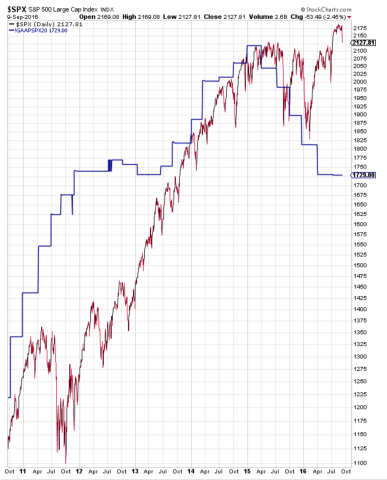
Clearly not impossible to go to a new 52wk low
P/E20 (blue line) has been a very strong RESISTANCE through history (see next post)
What's sure right now is that the market is pricing in a big rise in earnings so It has all the room to be disapointed if happens later than anticipated
I'm clearly bullish long term so an inverse H&S pattern would permit to gain time before earnings escape velocity (I said that I don't see the last ES2190 before 2018)
Comments
 Redarina

A fill of the open island below on NYA would suggest roughly ES 2030.
http://cdn.socialtrade.com/comsys/imgs/email-3387826-2_to56Si_m.png

http://cdn.socialtrade.com/comsys/imgs/email-3387826-2_to56Si_m.png

...
