User: Nf6: Earnings: Shiller PE Ratio Chart
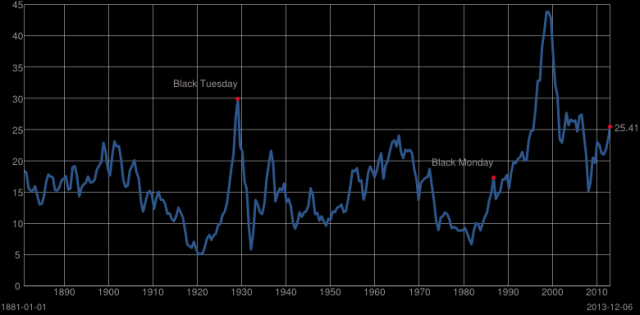
Shiller PE Ratio Chart
When I look at this chart I see three zones.
P/E < 10 = Super Value, Mortgage the House and Farm and Buy
P/E < 15 = Fair value = Buy
P/E < 20 = Fair Value = Buy/Hold
P/E < 25 = Richly Valued = Hold On for Dear Life
P/E > 25 = You have now kissed Reality Goodbye
Comments
 FLguy
FLguy
