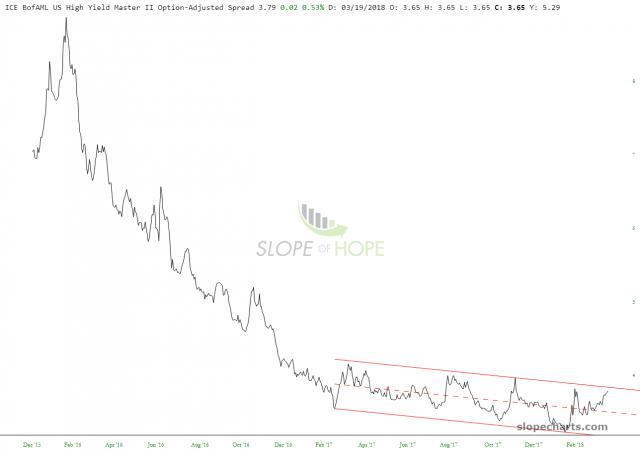
Nice chart, I would have tagged the upper line a little bit below and it would be the fifth test. Gonna break higher fore sure, only question left is timming... 3/30/18
@SILVERSINGULARITY I wasn't sure if I should count that as a throw over or not, but you're right, if the upper channel is set lower, it is right at the upper channel again. 3/30/18
Reading the comments, I don't think there is a right way or wrong way to draw this chart. Not saying you can just put lines wherever you want, but one shows a breakout and the other doesn't and both are valid. I'd say the jury is out which is most correct, especially since the trend is down and previous breakout attempts have failed. I'd even make the claim that if this breakout fails we can expect a real fast trip back to at least the center of the channel, and that's what I would be on the lookout for as it will screw a lot of people. JMHO.
One more thought - can this be drawn with a logarithmic vertical axis? 3/30/18


Gonna break higher fore sure, only question left is timming... 3/30/18