Browse Symbol Stacks: $INDU
Capture d'écran 2024-01-29 234311.png
S&P still not at ATH compared to bills and is now facing pot resistance

slopechart_$INDU.jpg
I saw this idea expressed in a YouTube video a while back and went after illustrating it in my own fashion for gig...

slopechart_$INDU.jpg
Another gopher head.

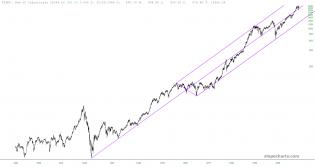
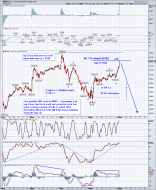
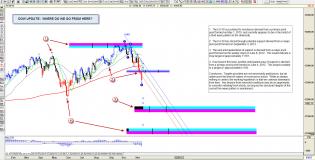
The Long Finger of Doom
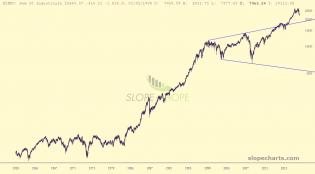
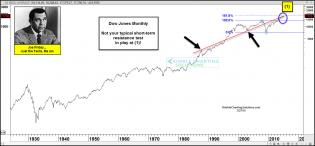
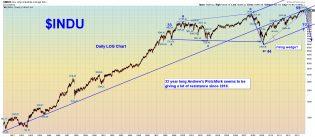
The Dow since 1900. I like how this pitchfork shows the last 25 years, The red oval is a wild-ass guess on a bea...
7
slopechart_$INDU.jpg
Punk ass rally on Industrials still falls short of the purple middle line of an Andrews Pitchfork that begins on 0...
slopechart_$INDU.jpg
Dow Jones Industrials tapped out at horizontal red triangle resistance. Purple line is the middle of the pitchfor...
1
slopechart_$INDU.jpg
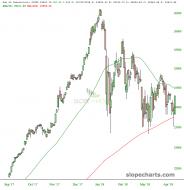
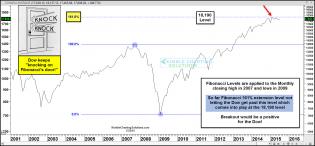
The highlighted candle is 3/6/2020 - 11 years to the day that marked the Financial Crisis bottom for the Dow. The...
1
slopechart_$INDU.jpg
The highlighted day is 3/6/2020. The nearby amethyst line is the center line of a pitchfork that begins on 3/6/2009.
1
slopechart_$INDU.jpg
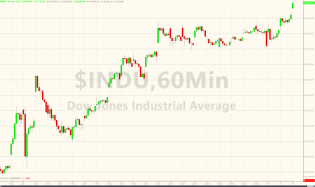
The Tourist Index stopped just 48 points shy of the 23.6% Fibonacci retracement level.
slopechart_$INDU.jpg

1
slopechart_$INDU.jpg
Fib friendly Dow Jones Industrial Average going back 88 years. About 900 points on the downside will tag the near...
2
slopechart_$INDU.jpg
Just a blip here, too
2 feb14.PNG
bfmCC52_0.jpg (966×506)
1 jan16.PNG
3
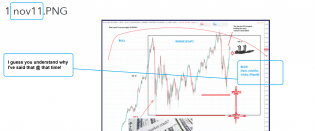
1 nov19.PNG
3

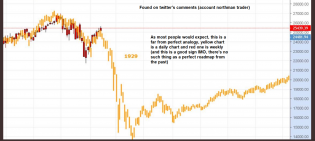
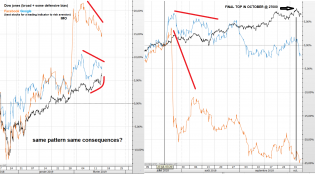
Investing in Chinese Stocks—投资大中华地区股市: The Impeachment Analog
Impeachment Analog

1
slopechart_$INDU.jpg
The Tourist Index
1 feb17.PNG
2
1 feb16.PNG
6 feb15.PNG
2018-12-26_12-57-27.jpg (890×435)
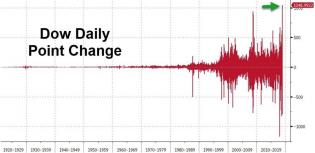
Today was the biggest Dow Jones point increase IN HISTORY!!!!!
1
slopechart_$INDU.jpg
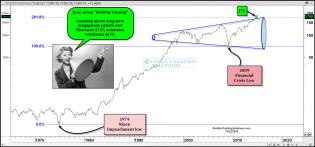
Revisiting one of Mr. Prechter's favorite hypothesis. Some U.S. history included. War in Vietnam, war on poverty,...
1
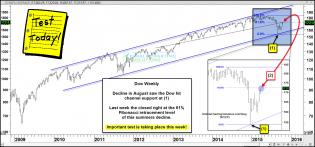
dow-testing-top-of-70-year-channel-after-megaphone-breakout-july-31...
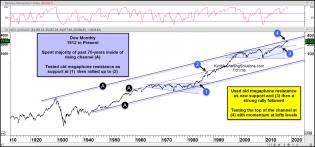
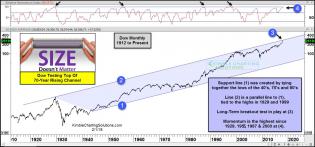
Dow Jones Industrials Bumping Into 70 Year Channel Resistance
2
2018-06-21_10-18-34.jpg (769×552)
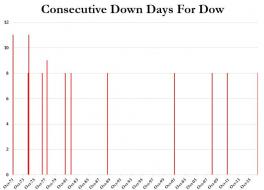
There has not been a longer Dow losing streak since 1978!!
slopechart_$INDU.jpg
We are simply crawling ever closer to the cliff. Take in the view while you can...

1
20180202top.png
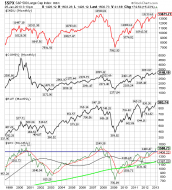
The Dow-30Y treasury ratio is at extreme overbought levels. Comparative periods: 1987, 1994, 1996, 1998, 2000, 200...
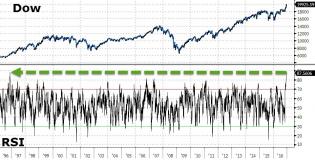
dow-testing-top-of-70-year-channel.jpg (1569×734)
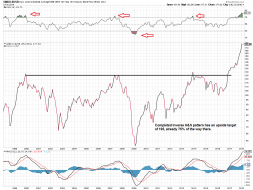
Below looks at a chart on the Dow since the early 1900’s on a monthly basis, with momentum applied in the upper...
3
20180104_25k3.png (890×529)
And The Dow tops 25,000 - the fastest 1000-point leap in history, as the Dow first crossed 24k on 11/30.
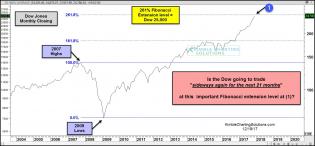
dow-testing-261-extension-level-going-to-trade-sideways-for-next-21...
Dow-Poised to trade sideways for 21 months again?
1
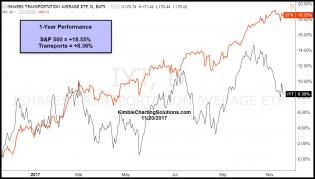
performance-transports-spy-1-year-nov-11th.jpg (1193×680)
Transports- Diverging for 1-year, testing important support

20170627indu_usb.png
Long-term look at INDU vs USD (30-Yr Treas). The Trump overshoot?
2017-05-22_INDU.png
INDU triangle. For it's limitations of having only 30 stocks, INDU respects patterns more than the other indexes.
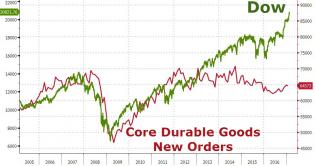
20170227_durgoods3.jpg (964×511)
Market divergence #9,839,923 - durable goods versus the $INDU
1
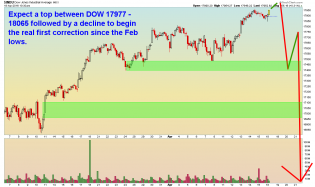
2017-02-10_INDU.png
Double Bottom target of 20585 remains. Earliest target date is early early March which also fits with my $SPX tar...
2
20161213_EOD8.jpg (960×489)
The Dow has now been overbought for 23 days in a row...at the most overbought in 20 years...
5
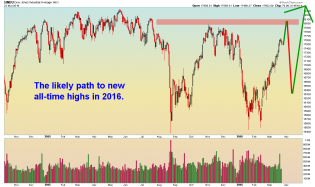
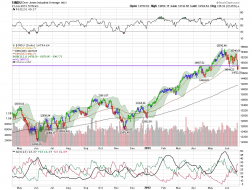
djia.png
Dow Jones Industrial Average $INDU. Volume declining. Slow stochastic indicates that move up is on an elastic band...

dow-mega-phone-support-pattern-june-7-2.jpg (1570×734)
Dow megaphone pattern
1
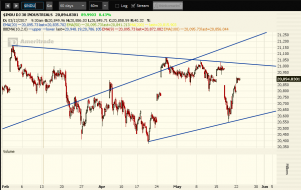
DOW - 1 hour - 4.18.16.png
DOW, 1 hour chart. This is not investment advice.

2
$INDU - Daily - 3.23.16.png
DOW - Daily. This is not investment advice.
6
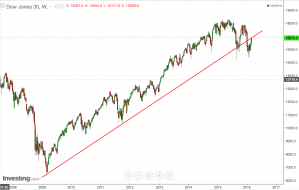
ym-weekly.png (1986×1258)
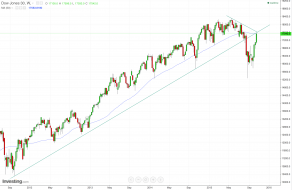
Dow weekly chart quite plainly has broken its trendline
djia-macd.png (2448×1412)
Highest. MACD. **EVER**
2
ym-f.png (2688×1744)
Think this chart is bullish? Please visit your nearest optometrist.
1
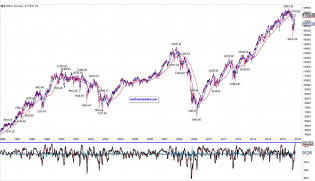
dowimportanttestoffib61leveloct19.jpg (1570×734)
Key test for Dow Industrials
2
dowtesting70yearsupportsept30.jpg (1577×740)
A very long-term perspective of the Dow Industrials channel
dowknockingonfib161doorjuly231.jpg (1571×733)
Key Fibonacci level on the Dow
1
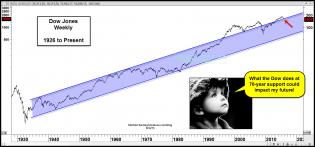
joefridaydowlongtermnottypicalpricetestmar27.jpg (1569×732)
Very long term Dow
dowmegaphonefibextensionbreakoutdec22.jpg (1572×735)
Megaphone pattern on the Dow
1
2014-07-08_INDU.png
$INDU rising wedge

20140502indu_usb_tripletop.png
Never seen this before, a ratio of the Dow and 30-year bond price. Peaked at the last two market tops.
1
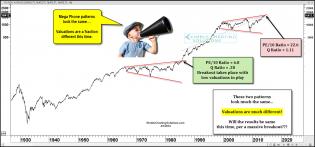
dowmegaphonelookalikesvaluationsdifferentapr7.jpg (1571×734)
2
$indu 5 min Fib relationsips 11.10sc.png
Interesting (at least to me) Fibonacci relationships on the 5 min. INDU.

2013-10-26_$INDU.png
$INDU is approaching resistance area.
INDU Andrews pitchfork 10.22.13sc.png
Like many of you I am tired of this bull market. Well, fork you Bull. Tonight I am going out to find a fat lady...
1
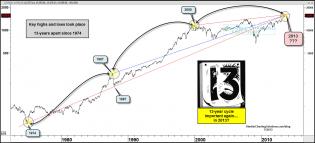
dow13yearcyclehereagainjuly301.jpg (1571×716)
This cycle/pattern suggests a historical price is not far away in the Dow!
sc.png
after an 8 month, unending trend up .. bears finally have a technical advantage with the major support break .. th...

SPXmonthly-voyeur8.png

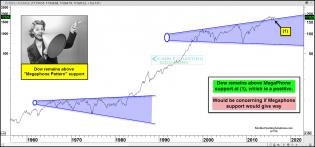
dow70yearwalkingfinelineofsupprtnov27.gif (1575×728)
Dow remains at the top of its 70-year channel, walking on a fine line of support!
Dow Update.jpg


http://www.sikharchives.com/wp-content/uploads/2009/12/helicopter-b...
Helicopter Ben

Large_fkkgqrg
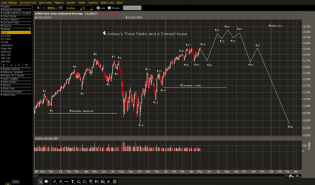
Here's a three peaks and a domed house prediction offered by Sloper Rod Tidwell