Browse Symbol Stacks: IWM
slopechart_IWM.jpg
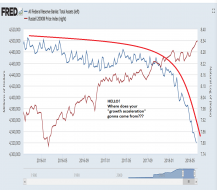
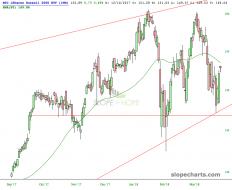
important support here
(is there an echo?)
slopechart_IWM.jpg
No earnings? No problem.
s3.amazonaws.com/cdn2.soci..._eAuPJQ_l.png
IWZM Dark pool at EOD highs
VolumeLeaders.com
slopechart_IWM.jpg

slopechart_IWM.jpg
Fun with channels. Look at the up-trending channel's top line and how it follows the lows of the last year.
2
slopechart_IWM.jpg
Amazing Fib levels
Stock market correction or something worse? | Notes From the Rab...
Err, not so good for small caps. Resistance test and re-drop.

1
slopechart_IWM.jpg
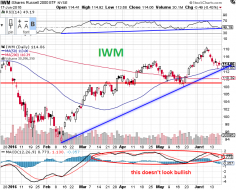
IWM looks ready to break out of the yearlong range to the downside.
slopechart_IWM.jpg
One day it'll go down nicely, lol
slopechart_IWM.jpg
IWM: Almost the entire year of 2021 was in a 15 point range.
You can bet a lot of eyes are on this ‘W’ pattern | Notes Fr...
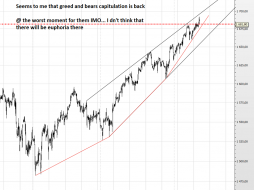
So, are small caps going to be a leg kicked out from the market's table or are they going to hold trend off this '...
Small caps at critical support | Notes From the Rabbit Hole
Small caps at, err... important support.
slopechart_IWM,TLT.jpg
Bonds vs small caps
slopechart_IWM.jpg
First time doing this I'm new here.
3
slopechart_IWM.jpg
The range is narrowing, the squeeze is on. Declining volume
3
slopechart_IWM.jpg
Waiting for some lines....any lines....to break.
Stock market risk not yet realized | Notes From the Rabbit Hole
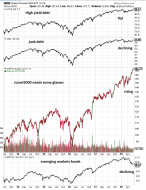
Beneath the headline indexes participation blows.
Will the US stock market’s worsening breadth matter? | Notes F...
Bad breadth!
slopechart_IWM.jpg
Ascending triangle.

2
slopechart_IWM.jpg
IWM - breaking the Orange trendline means it will likely head down to the Green and Purple. Purple is top of theC...
1 Feb9.PNG

5
slopechart_IWM.jpg
Bear killer, 25% in 6 weeks...
1
slopechart_IWM.jpg
slopechart_IWM.jpg
Holding up

2020-11-10_11-36-46.jpg (1280×496)
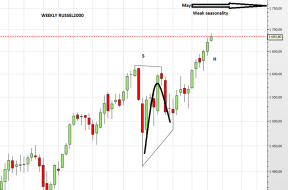
This is the biggest 2 day outperformance of the Russell 2000 over the Nasdaq 100 since March 2001...
slopechart_IWM.jpg
Has done well
slopechart_IWM.jpg
Pushing against channel top and another day like today will see a new ATH.
slopechart_IWM.jpg
Ripping the face of Bears who over stayed their welcome
slopechart_IWM.jpg
Engulfing candle
slopechart_IWM.jpg
The weakest Index all year and remains the weakest.
1
slopechart_IWM.jpg
If this goes positive on the year lookout
slopechart_IWM.jpg
The Weakest of the 4 indexes. It's not getting back to the ATH
slopechart_IWM/SPY.jpg
Small Caps vs. Large Caps - Maybe this ratio will bottom just in time for the election.
1
slopechart_IWM.jpg
slopechart_IWM.jpg
1
slopechart_IWM.jpg
Still a laggard. Made shorts cry last week.
slopechart_IWM.jpg
1
slopechart_IWM.jpg
Russell 2K still squeezed in this triangle
slopechart_IWM.jpg
fibs and gaps crazy how they are to the penny. Tim will love this one
Stock Market Sector Rotation Should Peak Within 60+ Days – Par...

slopechart_IWM.jpg
The broad based RUT will hit all time highs. Irresistible force meets immovable object.
ibd-small-cap-breakout-attempt-in-play-nov-25.jpg (1852×899)
iwm
2
slopechart_IWM.jpg
G7 please please please!
END THIS MONSTER!
Kennedy, Reagan ... ... ... Trump IS MUCH BUTTER!
3% Get SUM!...

5
slopechart_IWM.jpg
...
slopechart_IWM.jpg
I think I've spotted my first Diamond Pattern in the Russell IWM, fighting right now between the 2009 trendline (d...

4
slopechart_IWM.jpg
Thanks @TK -thanks for being on vaca
/TF breaking <1555.00 Rut Ro
/GC targeting Sub $1400.00 again.
$TRX...
1
Small Caps May Lead A Market Rally – Technical Traders Ltd.
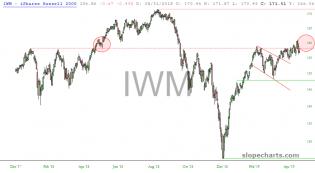
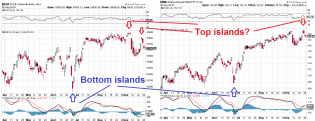
slopechart_IWM.jpg
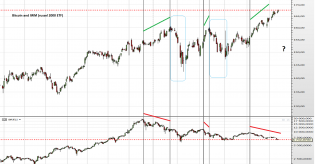
I would be looking for a similar price pattern in the right circle as the one that appeared in the left circle as...
1
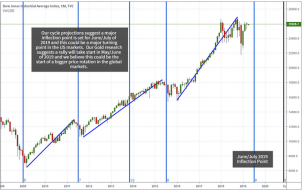
Proprietary Cycles Predict July Turning Point for Stock Market...
June/July Market Top
1
russell-testing-dual-support-with-momentum-at-2009-lows-dec-21.j...
1
Rut… No, Not Yet – Notes From the Rabbit Hole
RUT/SPX leadership should be watched. It's firmly down trending.
1
Rut… No, Not Yet – Notes From the Rabbit Hole
RUT is the downside leader, possibly neg. diverging USD.
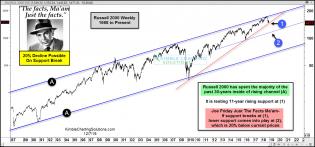
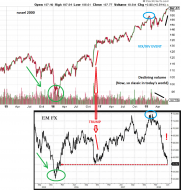
joe-friday-russell-could-fall-20-percent-if-support-gives-way-dec-7...
1
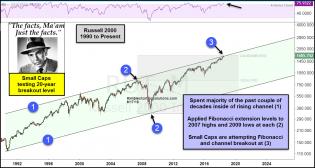
joe-friday-small-caps-attempting-20-year-breakout-aug-17.jpg (12...
1
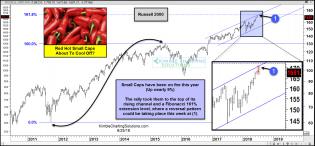
small-caps-russell-red-hot-create-bearish-reversal-pattern-june-...
3
6 june15.PNG
4 june15.PNG
3 june15.PNG
7 june13.PNG
4
6 june13.PNG
4 june13.PNG
3 june13.PNG
2 june13.PNG
1 june13.PNG
2
7 june12.PNG
6 june12.PNG
2
5 june12.PNG
3 june12.PNG
2 june12.PNG
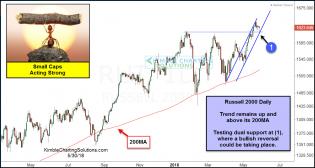
russell-acting-strong-testing-dual-support-may-30.jpg (1228×658)
Small Caps acting strong & testing dual support
2018-05-30_7-15-56.jpg (890×469)
1
2018-05-16_9-38-28.jpg (890×466)
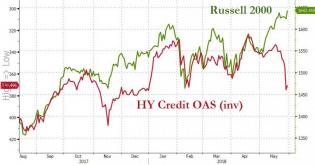
Russell 2000 Surges To Record High As US Economic Data Dumps
1
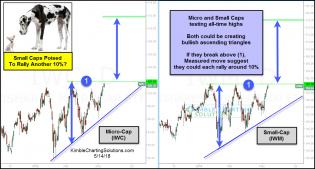
micro-small-caps-could-each-rally-10-percent-measure-move-may-14...
Small cap strength
slopechart_IWM.jpg
Closer look IWM
2
slopechart_IWM.jpg
Russell 2k looks pretty vulnerable and is leading the bounce up to the 50 day
1
20171002_eod5.jpg (955×477)
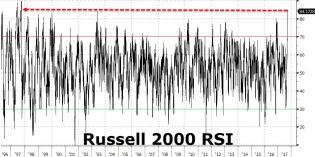
Russell 2000 small caps most overbought in 20 years...
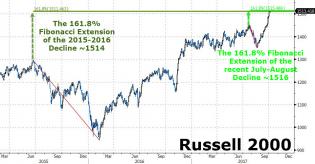
20171005_RUT.jpg (959×502)
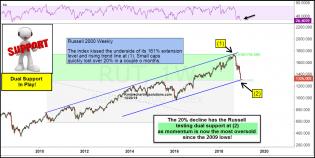
For example, in this case, we see the Russell 2000 now reaching the vicinity of the 161.8% Fibonacci Extensions of...
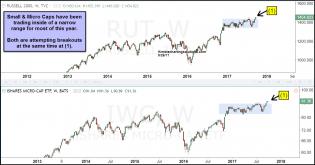
small-and-micro-caps-attempting-breakout-at-same-time-sept-26.jp...
Small Caps and Micro Caps have been creating look-alike patterns for the past few years, reflected in the chart below-
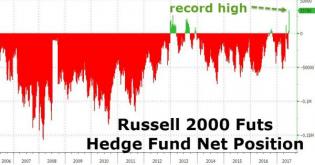
Hedge Funds Have Never Been This Bullish About Small-Cap Stocks...
Over 57,000 Russell 2000 e-mini contract longs were added in the last two weeks - the most since July 2008 - leavi...
1
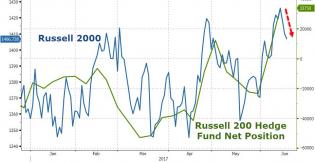
20170618_RUT2.jpg (962×500)
The last two weeks have seen the biggest increase in hedge fund bullish Russell 2000 positions since July 2008 pus...
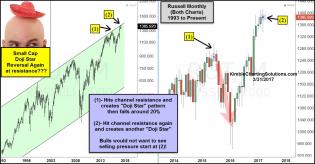
russell-create-another-doji-start-monthly-reversal-pattern-at-15-ye...
The two charts below of the Russell 2000 index might be very important to keep an eye on. Both are monthly charts...
2
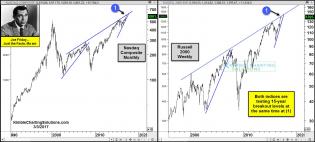
joe-friday-nasdaq-and-russell-testing-15-year-breakout-levels-march...
Nasdaq & Russell attempting 15-year breakouts
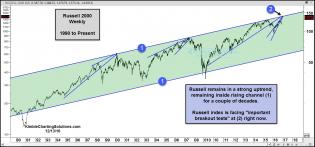
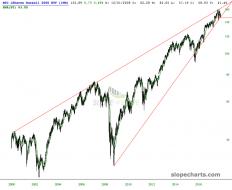
russell-at-top-of-25-year-rising-channel-dec-13.jpg (1572×734)
Russelll channel
2
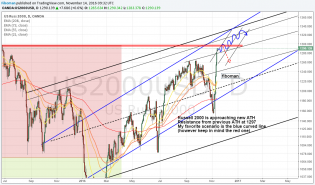
us2000 14.11.16.png

11 sept26.PNG
NYSE composite and russel 2000 etf
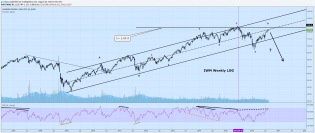
Chart 2 Russell 2000 weekly log with channel.png
Here is the second chart. Posting two charts that suggest to me that this would be an excellent time for the Russ...

IWM - Monthly - 7.29.16.png
IWM - monthly chart. This is not investment advice.

3
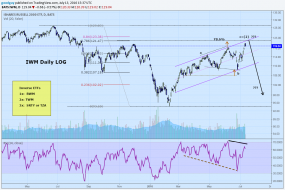
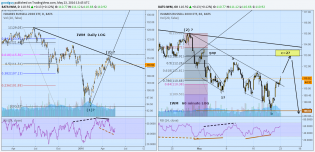
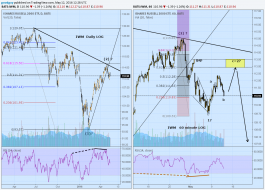
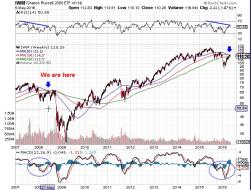
IWM Daily LOG.png
Here is my current view of the small caps. The weekly chart (not shown) has developed a negative reversal in the R...
4
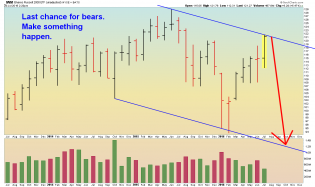
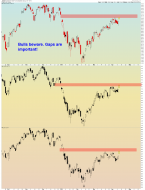
20160709_SPX_DJIA_IWM_NDX.png
Bears still have a chance

1

IWM - Weekly - 6.27.16.png
IWM weekly. This is not investment advice.
3
iwm_19_06_2016.png
June 20, 21, 22 is a days of big treasury auctions. It might hit market again like auctions of June 7, 8, 9 did....
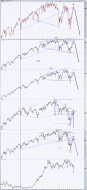
Weekly canles suggest more downside ahead.png
Notice the weekly candle formation for some of the major indices. This is also my current view of what I see as a...
1
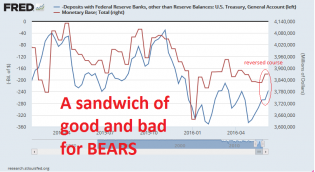
Treasury.png
I have studied Treasury financing schedule (debt issuance and redemtion) which is available at treasury.gov. Q2 wa...
2
2016-06-10_1454 - irazmo's library
$TZA forever and a day
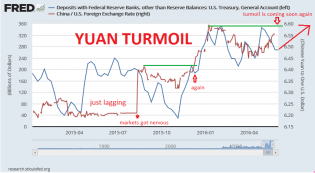
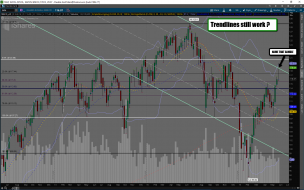
YUAN_AND_US_MARKETS.png
There is correlation between USDCNY and U.S. Treasury Account. Every time Treasury issue new debt (t-bills, t-note...
2
IWM Daily and 1 hour.png
Update on my posting of about 2 weeks ago. My target has stayed the same with a .62 correcion and possibly closing...
3
IWM daily and 1 hour log.png
Notice the major up move from around 2/10 was almost a .62 correction (on daily chart). I favor the most recent u...
2
iwm_weekly_2008_analog.jpg
I am short on iwm
3
Intermarket - Daily - 4.13.16.png
Intermarket. Daily chart. Market is likely about to top. This is not investment advice.
1
Looks bearish to me daily.png
This one is for Tim. After looking at Tim's charts for a year or so I thought I would try it out. No indicators. D...
3