Browse Symbol Stacks: $WTIC
20170101_oil.png
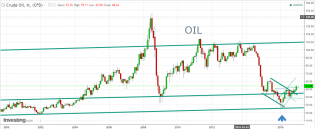
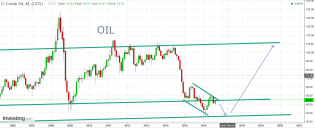
wedge breakout on monthly chart

20161224_oil_cot.png
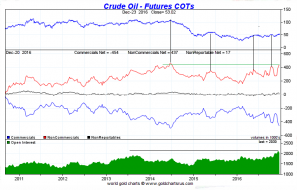
Market is too optimistic. Sizeable downside correction is very likely in coming months.
20161210_OIL_COT.png
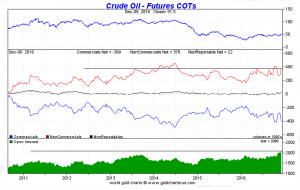
money flow to oil futures market
2
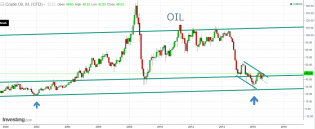
20161210_oil.png
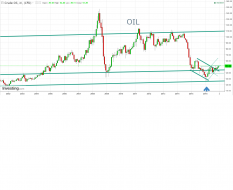
still in wedge
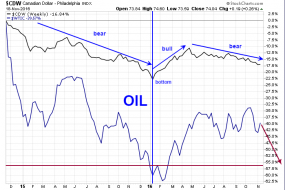
20161120_WTIC.png
looks bearish for oil
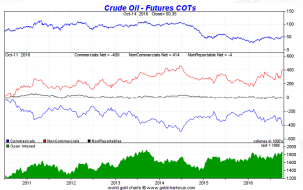
20161016_OIL_COT.png
speculator's long positions is in highest level from 2014. Looks bearish.
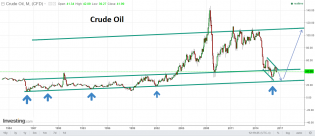
20161001_OIL.png
OIL has broken resistance. Test of this year minimum is not on radar now.
20160901_oil.png
august ended at resistance, it make possibility of this year bottom test a little more likely in next 6 - 8 months
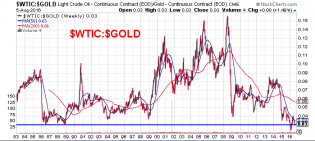
20160806_WTIC_GOLD.png
sell some gold buy some oil
2
20160806_CrudeOil.png
4
Oil - Monthly - 7.22.16.png
Oil - monthly. This is not investment advice.

9
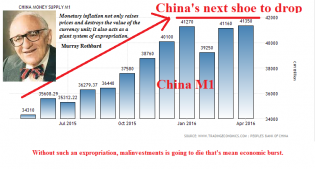
m1_china.png
I guess China's money supply growth rate has been significant driver of commodity demand recent months. Looks like...
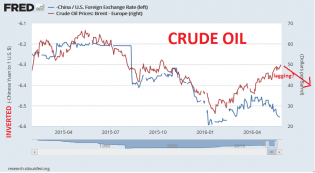
CRUDEOIL_YUAN.png
There is correlation between CNYUSD and Crude Oil. As I said in previous post CNYUSD correlate with Treasury Accou...
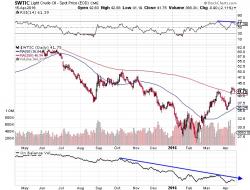
WTIC_OnBalanceVol.jpg
Where are the bulls?

Oil - Daily 2.9.2016.png
Oil daily. This is not investment advice.
2
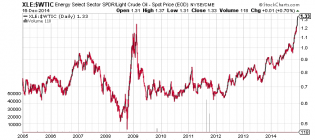
xlewtic20141217.png
Long crude, short oil stocks?

1
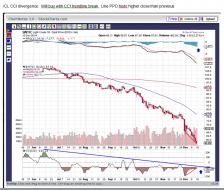
CL.jpg
/CL Will buy with CCI trendline break

11
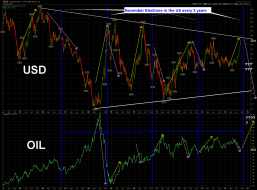
$USD OIL US elections.png
USD vs OIL with US elections every two years. Just because two things happen at the same time doesn't mean one is...

3
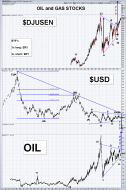
djusen and US dollar 12.24.13sc.png
$DJUSEN and $USD: Often when stocks move sharply UP a sideways consolidation will form and it can be in the form o...

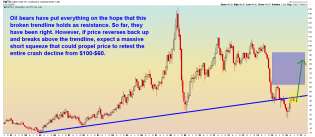
wtic04132013.png
Mini Head & Shoulders into a trendline break on higher volume. $WTIC

1