Browse Symbol Stacks: XRT
slopechart_XRT.jpg
XRT in trouble.
Blue trendline from Nov 2021 high.

slopechart_XRT.jpg
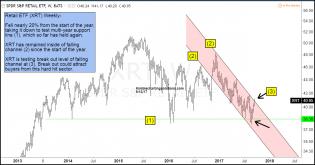
Retail wedge

slopechart_XRT.jpg
Beautiful topping candle, if it holds
slopechart_XRT.jpg
potential rounded top

1
slopechart_XRT.jpg
XRT - pressing against resistance for 19 weeks.
Weekly chart.
2
slopechart_XRT.jpg
XRT losing steam right when it needs it.
1
slopechart_XRT.jpg
Sitting on the 9EMA

slopechart_XRT.jpg
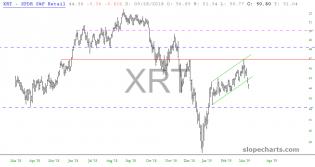
Trendline rejection and channel failure.
slopechart_XRT.jpg
XRT not finished with the upside.
1
slopechart_XRT.jpg
XRT is looking overbought, may be time to start shorting retail stocks.

bfm361.jpg (976×508)
1
slopechart_XRT.jpg
XRT hits overhead resistance and falls through channel support.
1

slopechart_XRT.jpg
Retail is ready to fail

3
slopechart_XRT.jpg
Retail bankruptcies hit an all-time high in the first quarter of 2018, with nearly a dozen prominent U.S. chains f...

2
slopechart_XRT.jpg
$XRT one to watch.
1
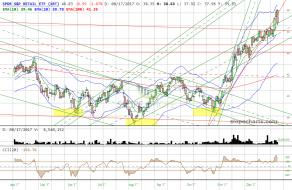
xrt-testing-breakout-level-sept-13.jpg (1292×680)
Most retail stocks have been something to avoid this year, as the majority of them have been hard hit! Could a tre...
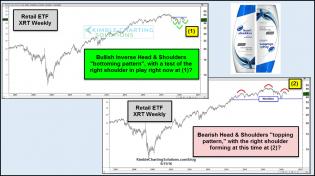
retail-head-and-shoulders-patterns-may-11.jpg (1173×658)
Retail breaking down
XRT
1
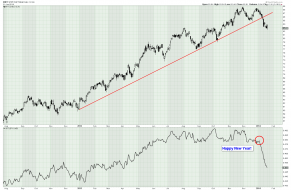
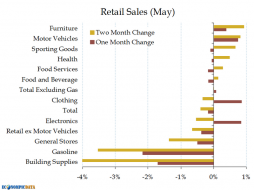
Retail Sales Charts
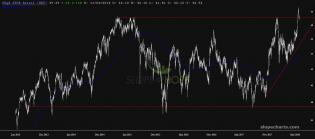
Retail sales adjusted for inflation and population - - looks like a huge topping pattern.
dshort Featured Charts
The red arrows depicted in the chart below are referenced and explained in the February article. As you can see in...
1
EconomPic
