User: Tim Knight: Historical Example: SP500-MarketUpdate-020216-2.png (990×438)
SP500-MarketUpdate-020216-2.png (990×438)
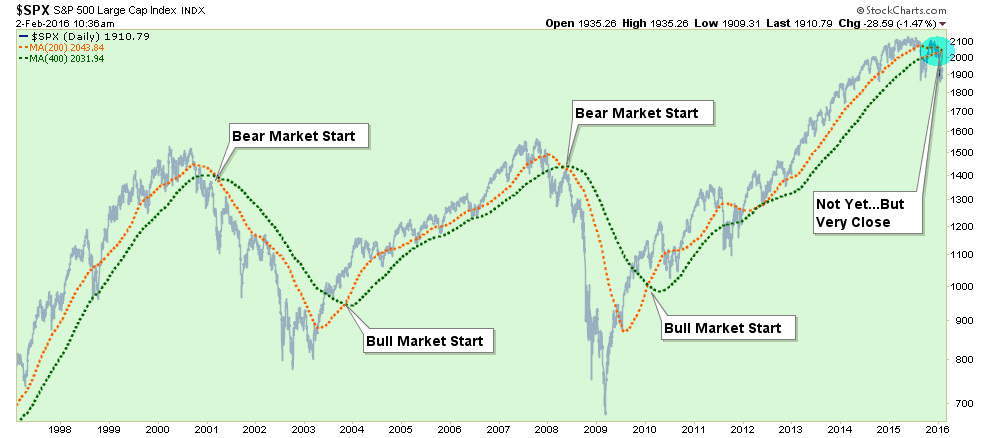
The millionth chart showing how we are repeating what happened in 2000 and 2008 Sort of like an 8 year cycle, ain't it?
The millionth chart showing how we are repeating what happened in 2000 and 2008 Sort of like an 8 year cycle, ain't it?
 Redarina


