User: TnRevolution: My Charts: SPX1816.jpg
SPX1816.jpg
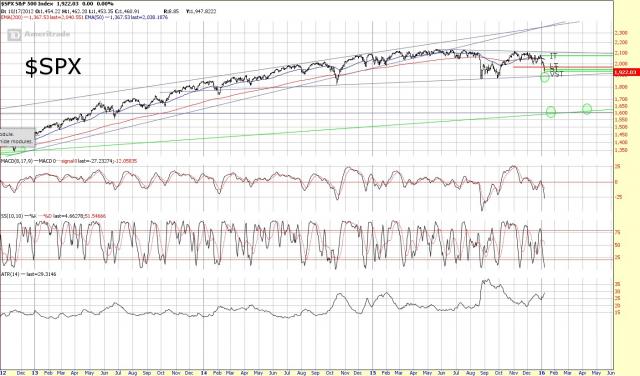
Key SPX points to watch in the coming months. First, as you can imagine all ATR timeframes are currently on a sell. For Monday VST buy reversal at 1934.5, ST buy at 1951.5. SPX would need to close the month below 1970 to flip to a LT sell.
On the larger technical picture, we've seen the indices develop a large topping pattern, with the key trendline being the connecting lows of the Oct 14' low and Aug 15' low. If/when that trendline gives way, my next target would be the 1600 area, which was the previous SPX highs of 2000 and 2007. That area intersects nicely over the next few months with what I've termed the "crash line". The green uptrending line dates back to the 1987 top, and has marked key points of breakout, support, and crashes/plunges over the past almost 30 years. Support in that area would make sense if the central bank fueled bull market is to continue for years to come, and a break under that line would mark the start of a more severe bear market in 2016, IMO. We should know early next
Comments
 KPack
KPack

