User: Hokie: Hokie's Stock Market Articles: An anatomy of a bear market – looking at Silver with classical charting principles | PeterLBrandt
An anatomy of a bear market – looking at Silver with classical c...

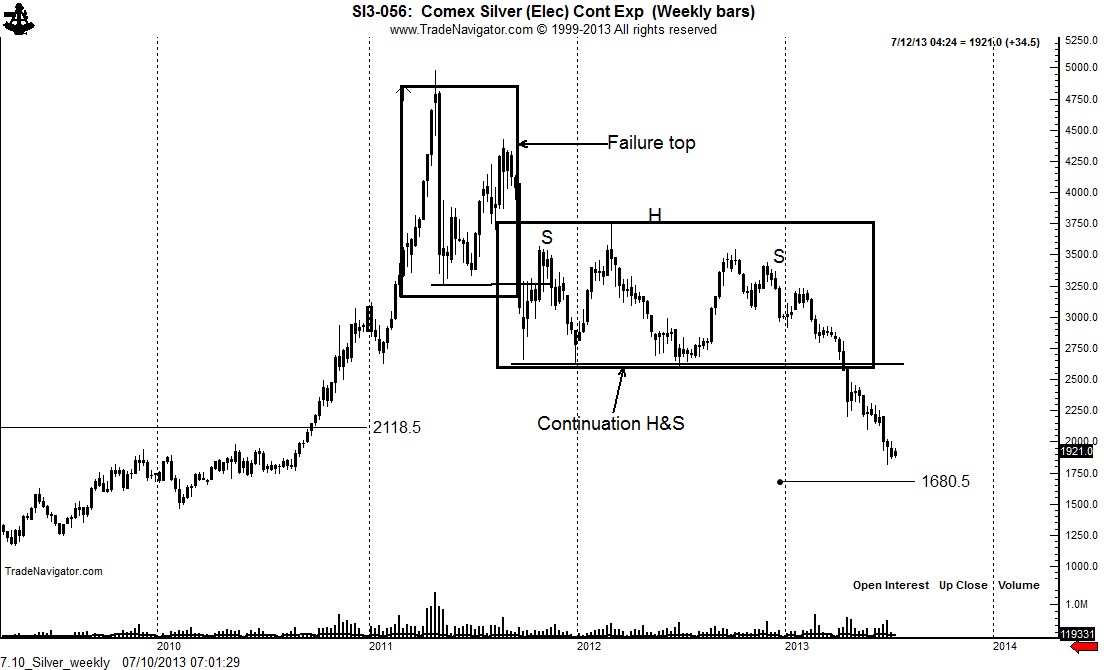
The bear market in Silver actually started during the blow off in April 2011. See blog post calling the top here.
The retest rally into the Aug. 2011 high fell way short of the top and a failure top was confirmed in Sept. 2011.
The weekly chart then formed an 18-month continuation H&S pattern. Elliott Wave technicians deny that this classical pattern exists. Edwards, Magee and Schabacker — the fathers of classical charting — all discussed this pattern. Elliott Wavers need to stick with wave counts and leave classical chart identification to classical chartists.
The decline in April 2013 competed the continuation H&S and established a target of the mid 1700s and then the high 1600s.
The daily chart displays several classical chart developments. First, a 5-month horn top was completed in mid Feb. This was immediately followed by a 5-week pennant that broke down on Apr. 1. An 8-week descending triangle formed following the sharp decline of Apr. 15. [A lesson on classical charting: Note that my lower boundary is drawn through the May 20 low. The May 20 decline is called an “out-of-line” movement. Pattern boundaries need to be drawn to best describe price congestion.
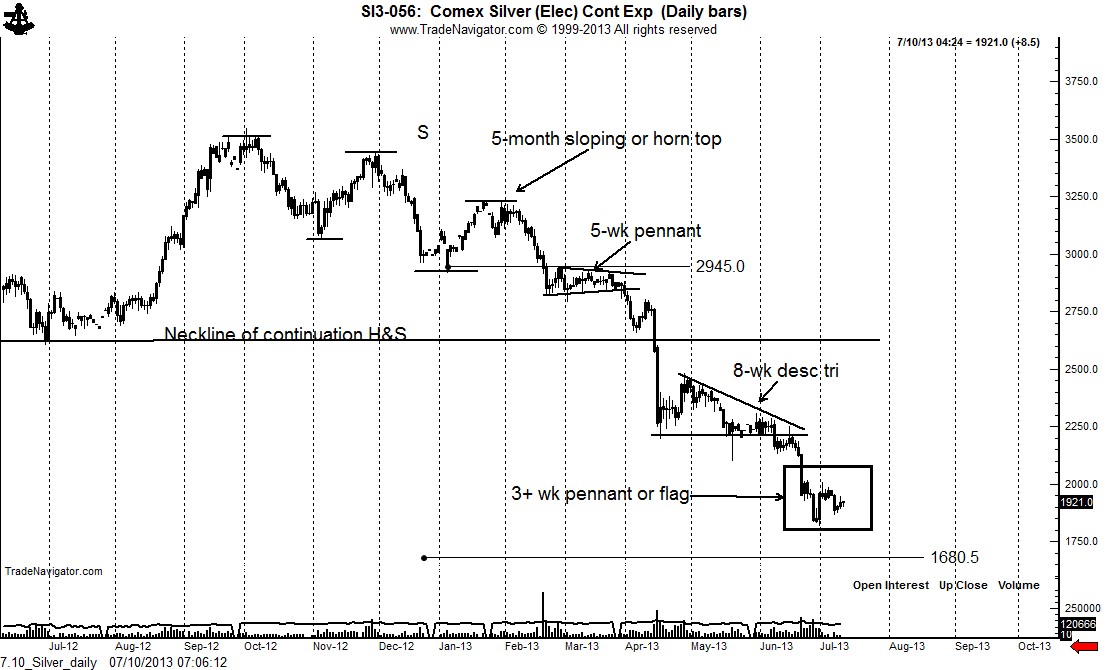
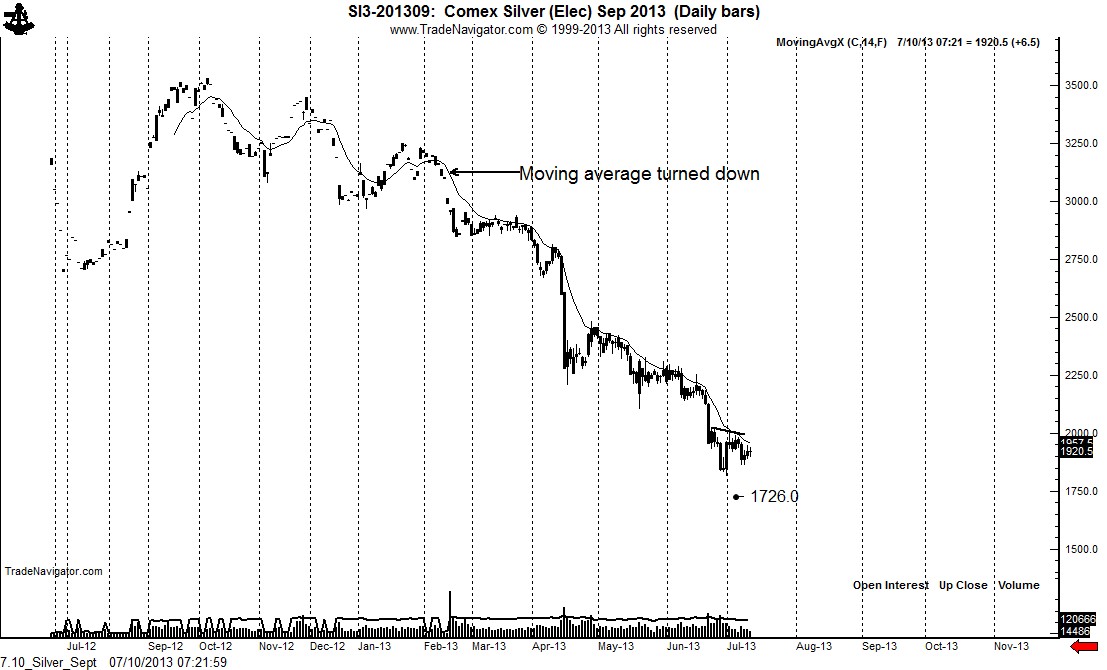
The market remains in a strong bear trend. This bear trend will remain fully in force as long as the moving averages remain down — I use a 14-bar MA. Note that this MA has been down for 21-straight weeks. The market is now forming what could become either a flag or pennant.
I hope a review of these charts demonstrate why I could care less about the nonsense of inflation, supply shortages, fiat currency concerns, and such nonsense. Price rules!!!
The information in this blog post represents my own opinions and does not contain a recommendation for any particular security or investment. I or my affiliates may hold positions or other interests in securities mentioned in the Blog, please see my Disclaimer page for my full disclaimer.
 View the discussion thread.
Comments
 Tomb
Tomb
