User: HeadsUWin_TailsILose

Personal Stacks
All Pages Stacked
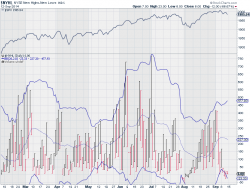
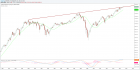
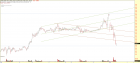
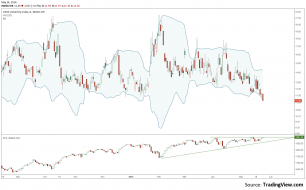
NYHL_09.13.2014.png
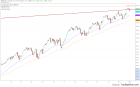
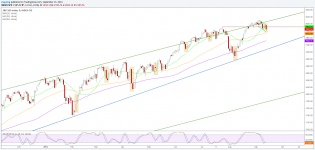
NYSE new highs/lows near the extreme bottom seen during early August pullback. Does this mean big upside soon? Any...

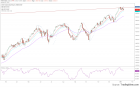
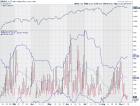
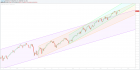
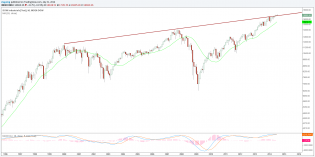
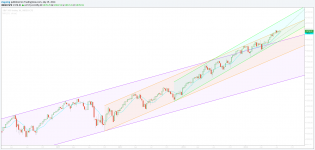
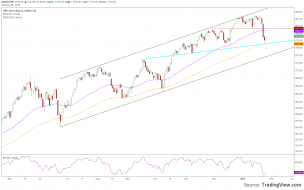
spx_daily_09.13.2014.png
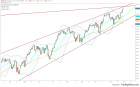
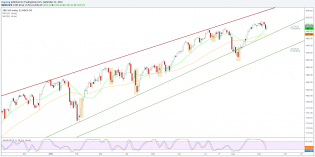
SPX daily showing pullback from top of the channel and also has highlighted Thur/Fri prior to opex. Seems to be bu...
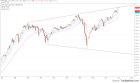
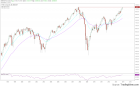
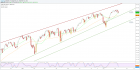
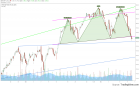
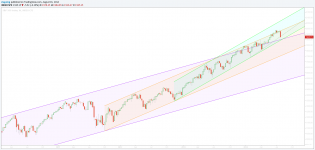
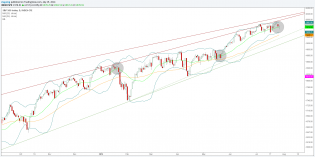
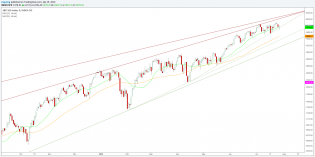
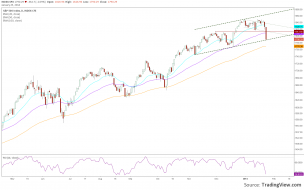
spx_wkly_09.13.2014.png
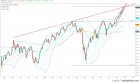
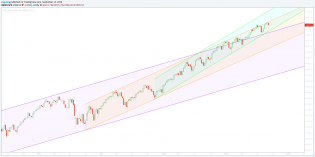
SPX weekly just pulling back slightly from the top of the middle channel formed in Oct 2012.
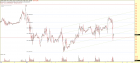
spx_opex.png
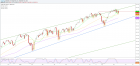
Thu/Fri of the week prior to SPX opex appeared to mark a low in 5 of 7 most recent instances.
3
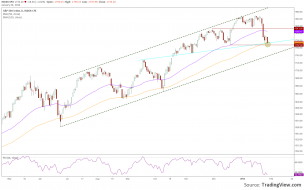
spx_08012014.png
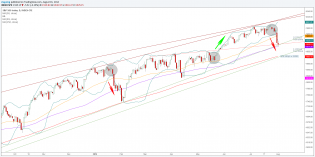
SPX daily broke down thru 50MA and lower BB. Bounced off the 89MA today and sitting at trendline from 10/2011. NYM...
1
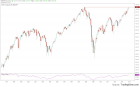
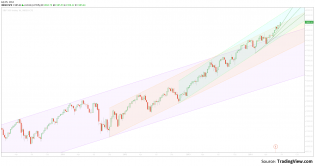
spxWk_08012014.png
SPX weekly still holding in the uppermost green channel. But also turning back towards the bottom of its channel w...
dow_07312014.png
I see this DOW monthly chart which on a weekly/daily basis is breaking that trendline.
1
spx_daily_07292014a.png
With the SPX bollinger band compression of ~30 pts, rising VIX, and declining breadth - will it soon break hard do...
3
spx_weekly_07292014.png
SPX weekly holding up - see if it can close below 10MA which hasn't occurred since April.
spx_daily_07292014.png
SPX daily still holding up.
spxWk_07052014.png
SPX weekly - guess there are only blue skies...
1
spx_05242014.png
VIX closed below lower BB and near the 3/2013 low. Only wonder if it continues downward taking SPX to more ATHs, o...
spx_01302014.png
SPX daily - looks like the confluence of 100EMA, prior low (~1768), and blue trendline are providing strong support.
1
spx_01292014.png
SPX daily - not including today's action which also touched the blue trendline. The 100EMA and blue trendline are...
spx_01252014.png
SPX daily closed below 50EMA and sitting just at the bottom of a short term channel/trendline from Nov. Maybe a re...
4