Users: moneymiser21: XLF_Weekly_Fibs_Oct262015.jpg
XLF_Weekly_Fibs_Oct262015.jpg
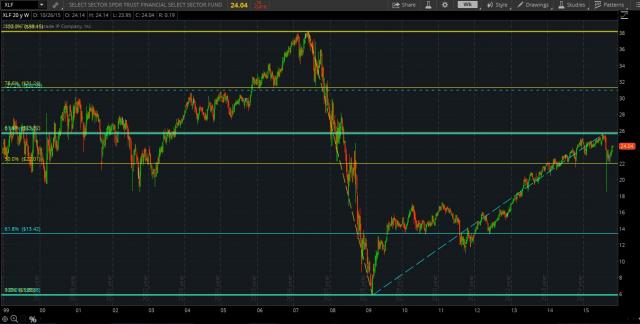
Will the BIG banks lead us lower?
Back in July, the XLF weekly chart rose to within 20-cents of its 61.8% retracement of the plunge from the 2007-2009 crash.
What followed was an immediate, hard, and fast sell-off spike down beneath 20 (August 24th mini-flash crash), and recovery to current overhead supply.
If we were to see a 61.8% retracement of the up move off the 2009 bottom, it would take XLF down to 13.42, and a re-test of prior support that took about 2-years to form.
From there, we'll see if there's enough juice to move XLF back up to form a Gartley pattern between 30.99 and 31.24
Comments
No comments yet.


