Users: moneymiser21: All Pages
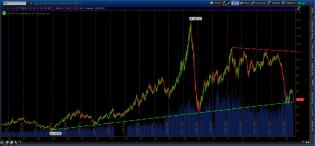
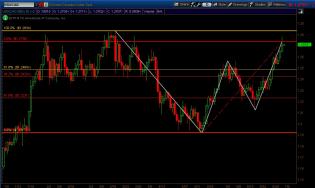
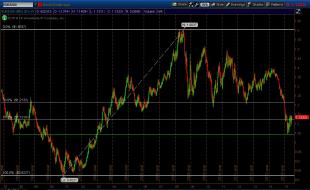
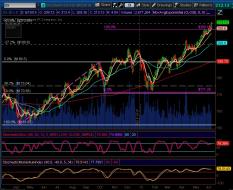
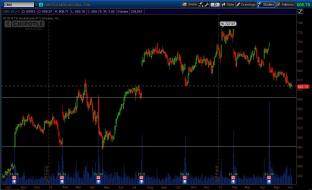
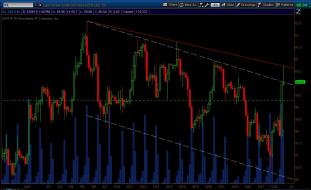
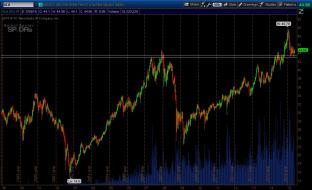
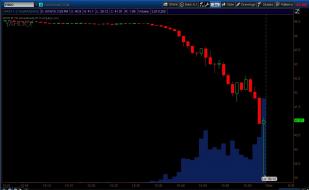
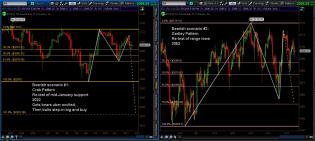
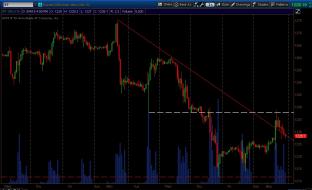
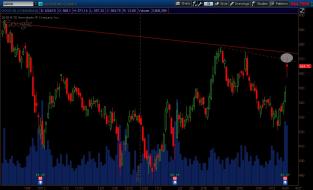
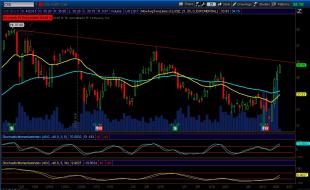
slopechart_AAPL.jpg
Apple weekly chart gap holding as resistance so far

slopechart_AAPL.jpg
Apple re-testing its prior weekly gap down range from late Summer 22
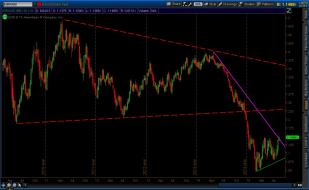
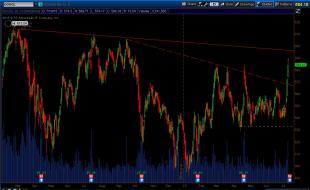
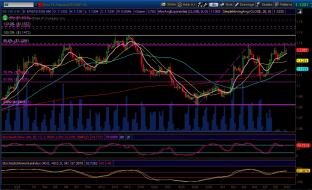
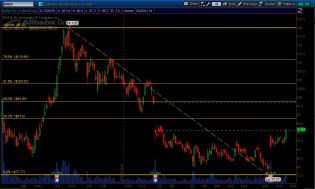
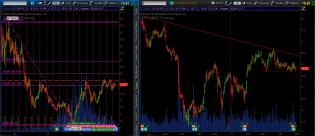
slopechart_USD/JPY.jpg
USD/JPY daily chart holding downtrend line pretty well
2
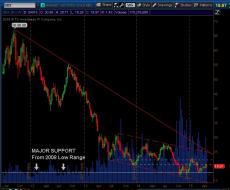
slopechart_/CL.jpg
Hmm... /cl monthly chart with a trendline connecting the 2009 low to the 2016 low

slopechart_WWE.jpg

slopechart_WWE.jpg
1

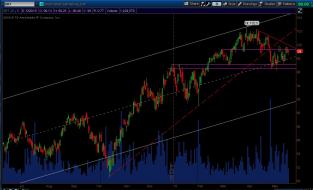
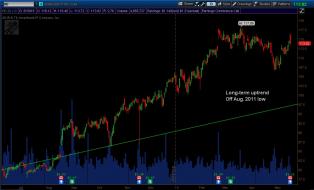
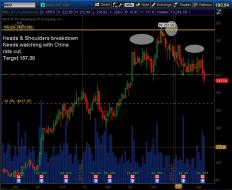
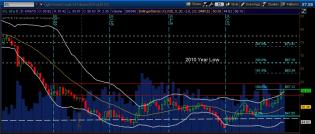
slopechart_$RUT.jpg

Gold_Weekly_Wedge_Feb082016.jpg
Gold kicks off the week making a third touch of the downtrend line off the /gc (continuous) chart 2014 high.
We've...
1

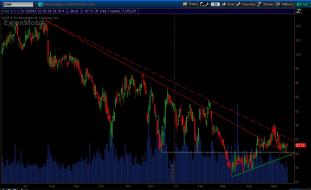
XOM_Daily_Nov022015.jpg
The bears have hope yet, and it lies in the oil sector.
Exxon-Mobil's rise post-earnings from last week took it...
1

XLF_Weekly_Fibs_Oct262015.jpg
Will the BIG banks lead us lower?
Back in July, the XLF weekly chart rose to within 20-cents of its 61.8% retracem...

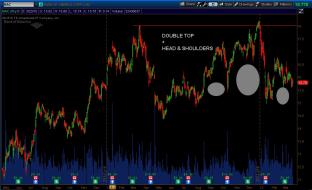
BIDU_HeadAndShoulders_Completed_Sept2015.jpg
Updating my post from May (http://slopeofhope.com/socialtrade/dynamic/file/full/18416)
BIDU has completed both...

EURUSD_Daily_Sept142015.jpg
Once again, the EUR/USD finds price action testing the downtrend line (purple) off the Draghi spike and reversal f...
1

TNX_Daily_Sept092015.jpg
Is the ten-year YIELD about to skyrocket?
So far this morning, the TNX has regained bullish momentum above the...

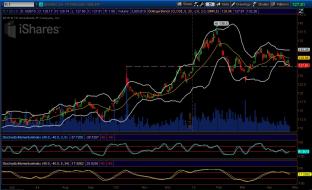
AAPL_Weekly_Aug242015.jpg
Notice where AAPL's decline stopped during Monday's sell-off.
In-between the 50-61.8% retracement of the move u...

AAPL_VolumeProfile_Aug242015.jpg
Here's the trading on AAPL, as it hit multi-month lows at $92 on Monday, August 24th
EURUSD_Trendline_Break_Aug242015.jpg
Overnight, the EUR/USD broke above its downtrend line from back in May 2014 when Draghi's words finally lit and ex...
1

Gold_Weekly_Channel_Aug212015.jpg
Where is gold?
The continuous /gc futures chart hit the middle of the extended down channel overnight.
Also...
es_keylevels_Aug202015.jpg
Now that the /es has erased all trade since the start of Q2 on a closing basis, We can finally look to key levels...
EURUSD_Daily_ReverseTrendlineTouch_Aug112015.jpg
EUR/USD after breaking and closing above its down trendline off the June swing high on the daily chart, has so far...
EEM_Weekly_july272015.jpg
EEM testing multi-year support level it had not traded since late June of 2013
Crude_UptrendOff1998_July222015.jpg
Uptrend of /cl off 1998 low
2
Dollar_Crude_Monthly_July222015.jpg
Swings in for /dx and /cl?
1

nq_Daily_ABCD_FibMove_July212015.jpg
/nq nears AB=CD move target on daily chart at 4705.50, based off the October 2014 swing low to the Nov. 2014 swing...

Gold_DailyWeekly_FibTargetHit_July202015.jpg
Asian traders dumped gold on their RTH open Sunday night (9pm EST).
This push sent /gc beyond its daily chart f...

INTC_Daily_July152015.jpg
Going into earnings this afternoon, a MONSTER head & shoulders for Intel on the daily, with 29.56 the key level to break
2
GOOGL_Daily_July152015.jpg
GOOGL achieved part one of a three-part bullish reversal on Tuesday.
It followed through on the break and close...
DollarIndex_Daily_July142015.jpg
Dollar index flashes near warning signal for bulls, following the Iran deal.
The dollar sold-off, holding the f...
1
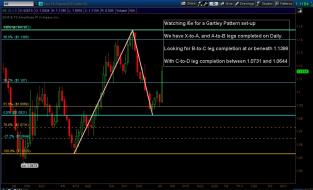
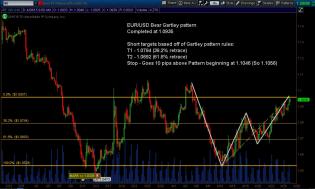
USDCAD_BearGartley_Daily_July072015.jpg
USD/CAD on the daily chart triggered a bear gartley pattern during Tuesday's trade when it touched 1.2736.
Note...
1
CL_Daily_July032015.jpg
With most U.S. traders away, Asia & EU traders decided that down was the way on /cl July 3rd.
After finally bre...
3
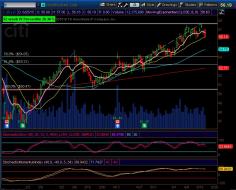
Citi_Daily_Fibs_June252015.jpg
Time for a pullback in Citi.
C hit its 1.272 fib projection target from its rally off the double bottom at the...
1
EURUSD_Daily_Trendline_June222015.jpg
Shifting from the weekly to the daily chart on the EURUSD, price is nearing the primary downtrend line from the Ma...
2
EURUSD_20yrWeekly_Fibs_Support.jpg
Updating the long-term picture on the EUR/USD
Please note how a support level from August of 1997 (1.0414) has...
2
HSY_Daily_June192015.jpg
FinViz chart plus cocoa crop problems, plus biz problems add up for shorting HSY
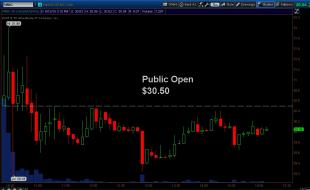
WING_IPO_June122015.jpg
Bankers yay, public screwed again by a fast food IPO
IBM_Monthly_June102015.jpg
IBM on the long look.
Show disbelievers in technical analysis this chart next time they speak.
Pretty much n...
GS_Daily_June102015.jpg
I'm going to tempt the wrath of the market gods with this one (I know you're paying attention Goldy!)
From a pu...
6e_4Hour_SharkPattern_Complete_June102015.jpg
And THIS is why I closed out my FXE long position Monday afternoon.
Overnight /6e FINALLY spiked up into the Sh...
CL_Daily_June102015.jpg
Nothing like a good API -6.7mil DRAW to scare the children overnight.
Once again we've broken outside of the do...
1
COST_Weekly_vs_Daily_June092015.jpg
Optionable trade possibility for America's favorite big box chain, CostCo.
The close beneath 34-week EMA last w...
CMG_Daily_June092015.jpg
Our favorite overpriced burrito maker FINALLY closed a daily candle beneath its Oct. 21, 2014 low (607.55) today....
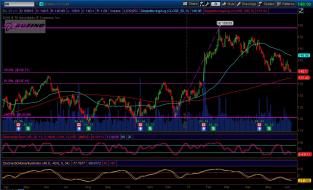
Boeing_Daily_June092015.jpg
Boeing setting up for a POTENTIAL long trade.
Today price dipped to just above the 50% retracement of BA's most...
EURUSD_GartleyPattern_Setup_June022015.jpg
EUR/USD setting up a POTENTIAL Gartley pattern on the daily.
For this to happen, the dollar would need to re-stren...
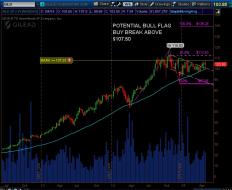
CL_Daily_June022015.jpg
With the bull flag breakout in /cl underway, let's look at potential targets higher.
/cl could not even correct...
1
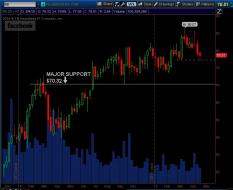
CL_ChannelBreak_May292015.jpg
Where did /cl stop its up move once it broke above the down channel you ask?
The red line knows. It was probab...
2
BABA_Daily_May202015.jpg
BABA closed back into its January gap down range.
Drawing a fib retracement from its high to low, notice how:
1...
XRT_Daily_May202015.jpg
Retail sector showing signs of topping.
The main ETF XRT:
1. Broke beneath its top trading range on the dai...
XOM_Daily_May202015.jpg
Exxon attempting to put in a higher low base at 86.19.
If /rb (gasoline futures) continues its outperformance o...
XLU_Weekly_May202015.jpg
All may not be lost for bond & interest rate bulls.
TK pointed out the downtrend line on TNX holding in the pas...
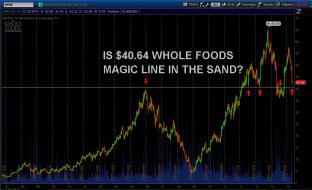
WFM_Weekly_May202015.jpg
Watching Whole paycheck for another attempt at this key level on its longer term chart.
$40.64 for some reason...
2
Pandora_Daily_May202015.jpg
Small short trade set-up on Pandora.
And really, who would want to get long a money losing internet streaming m...
Ford_DailyUpdate_May202015.jpg
Updating my post on Ford from May first -http://slopeofhope.com/socialtrade/dynamic/file/full/18355
The bearish...
4
YHOO_FlashCrash_May192015.jpg
Kudos to Market Sniper who had called YHOO short a few weeks ago, and noted $44 level to watch for new short entry...
2
HD_Daily_May192015.jpg
Home Depot sold hard off gap-up into earnings plus better than forecasted housing starts.
Note how the current...
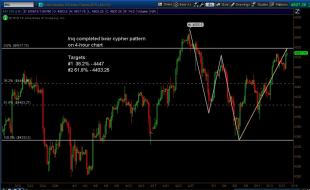
NQ_Futs_4Hour_CypherPattern_May182015.jpg
Bearish set-up fired this afternoon on the /nq.
We have a fibonacci bear cypher pattern on the 4-hour that comp...
TSLA_Daily_May182015.jpg
Time to begin looking at longer term TSLA short opportunities.
1. We have a 61.8% retracement from the all-tim...
2
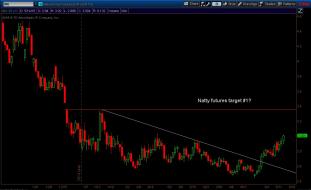
NG_Daily_May142015.jpg
Natty finally in bull mode heading into Summer swelter season.
We have break and hold above downtrend line off...
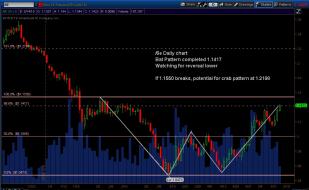
EURUSD_Daily_May142015.jpg
Updating my post from one week ago (May 7th).
Overnight the /6e (EUR/USD future) reached its bat pattern completio...
1
CAT_Daily_May132015.jpg
Adding CAT to the short set-up watch list.
We have rejection on the daily chart at prior resistance ($89.25ish)...
ZBM5_Daily_May132015.jpg
Wish I had marked this level on /zbm5 daily chart earlier.
High from first day of contract has served as suppor...
ES_4Hour_TwoBearFibScenarios_May132015.jpg
Zooming out a bit, the series of lower highs we've made on the /es since April 27th new all-time high, has set-up...
3
GILD_Weekly_May102015.jpg
I rarely trade bio-tech. But this GILD set-up on the weekly chart screamed at me.
Price (so far) has respected...
GDX_Weekly_May102015.jpg
GDX weekly chart nearly identical to /gc (continuous) weekly with the downward angled channel.
Note how the pas...
FB_Weekly_May102015.jpg
Facebook bounced off support from March on the weekly chart.
Should that area hold, we'd expect to see a move b...
3
EWZ_Weekly_May102015.jpg
Brazil ETF faces key resistance area test on weekly chart.
EWZ bounced off of major support from 2008 lows earl...
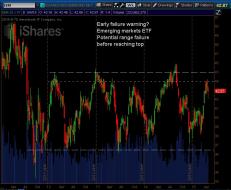
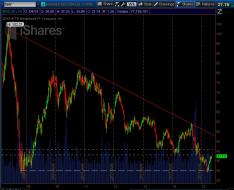
EEM_Weekly_May102015.jpg
Could emerging markets be rolling early?
The weekly chart of EEM suggests that possibility after failing to clo...
1
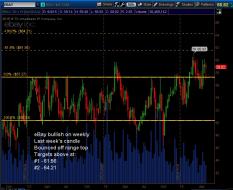
EBAY_Weekly_May102015.jpg
Bulls running eBay up into its forthcoming spin-off of PayPal.
Weekly chart held its prior range high, and boun...
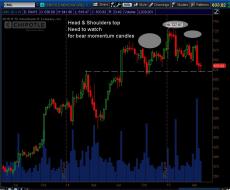
CMG_Weekly_May102015.jpg
Our least favorite overpriced burrito maker made a head & shoulders topping pattern on its weekly chart.
Probab...
BIDU_Weekly_May102015.jpg
I can't remember the last time BIDU looked bearish on a weekly chart.
Last week's price action arguably set-off...
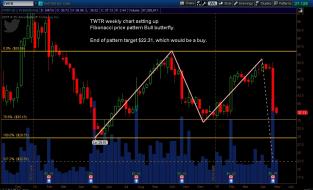
TWTR_Weekly_Butterfly_May072015.jpg
TWTR setting up for a deep fall if it can break beneath prior balance area on the weekly chart.
$22.31 is the t...
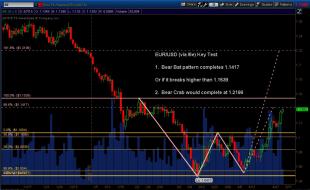
EURUSD_Daily_BearBatOrCrab_May072015.jpg
Key test likely today for the EUR/USD (via the future /6e).
We have one of two fibonacci price patterns setting...
GOOGL_Daily_May062015.jpg
GOOGL short update.
Following original breakdown beneath trendlines on earnings http://slopeofhope.com/socialtrade...
SPY_1hour_May062015.jpg
I SPY bear support snacks on the way lower...
YHOO_Daily_Gap_May052015.jpg
Credit to Market Sniper for calling the YHOO short last week.
Today, YHOO broke into the gap from the October 2...
CL_Daily_VolumeProfile_May052015.jpg
WTI Crude on daily 2-year chart.
Price cracked above $61 this morning, and is into a large low volume trading a...
1

Gold_Futures_Hourly_May042015.jpg
Gold futures hourly.
Interesting topping head & shoulders then a whoosh lower.
Followed by an inverted head...
2
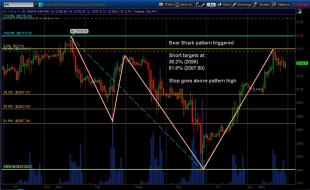
ES_Hourly_BearShark_May040215.jpg
/es hourly chart triggered fibonacci price pattern "Bear Shark" today. (Pink lines outline the offset "W" pattern)...
3
TF_hourly_May042015.jpg
/tf hourly update.
Price bounced off prior key support right to new resistance, then sold off.
However, the...
2
Ford_Monthly_Daily_May012015.jpg
Poor auto sales numbers today put Ford on bear watch.
Monthly chart shows Ford failing to hold trade above $17....
1
AAPL_Weekly_Channel_May012015.jpg
Another look at AAPL on the larger zoomed out timeframe.
Still nailing the top of the channel.
AAPL_Monthly_May012015.jpg
Update on AAPL monthly chart, as we begin May.
**NOTE: tos auto adjusts chart history for split.**
$144.56 w...
1
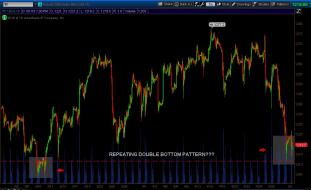
TF_hourly_May012015.jpg
/tf potential repeating double bottom pattern on hourly forming at prior support
CL_Daily_April292015.jpg
Small violation of the upper zone on /cl continuous, from bear wedge mid-late December 2014.
Luckily, as Tim no...
FB_Daily_April282015.jpg
As TWTR was getting pummeled, FB started plunging as well.
FB broke this trendline support on the daily. Howev...
TLT_Daily_Support_April282015.jpg
Fibs project bonds lower, but TLT is at an interesting support level.
1
EURUSD_GartleyPattern_April282015.jpg
EUR/USD or /6e Gartley Pattern completed on daily, 4-hour, and 1-hour charts this morning.
If this holds, look...
1
GOOGL_Daily_April272015.jpg
Something weird with GOOG. OCC added non standard options to chain starting today (April 27, 2015).
So switchi...
AAPLvsNQ_Daily_April272015.jpg
Heading into AAPL's earnings this afternoon, we see the /nq start to diverge somewhat from its largest component (...
BBY_Daily_April272015.jpg
Best Buy's sell-off still appears to have at least another $1.50 left to the downside.
Short and middle term mo...
GOOG_Daily_April242015.jpg
Look where GOOG stopped and reversed its gap-up post earnings.
ES_Voodoo_April242015.jpg
In fibonacci land, there's a branch that studies what they call "Voodoo" or "FibGrid" lines.
Basically you draw...
EURUSD_CypherPattern_April232015.jpg
Bear trade on EUR/USD (or /6e) set-up this morning.
It's a fibonacci based price pattern called a Cypher.
Targe...
1
ZBM5_Daily_April222015.jpg
Should bonds ever decide to give up this maddening push up, fibs say 150'13 could be an area to test.
Would be...
1
CSX_Daily_April222015.jpg
Spotted CSX on a scan for high IV Rank.
Nice downtrend, and post-earnings small double bottom on volume, pushin...
CrudeFuts_April162015.jpg
Sadly it appears the bear party is likely over in /cl with back-toback daily closes above the previous high of the...
Gasoline_VS_Oil_Futs_Monthly_March242015.jpg
Updating the divergence, or delay, in /cl futures vs. /rb (Gasoline) futures from their monthly chart bear wedge b...
1
BAC_Weekly_March232015.jpg
Bank of America setting up for potential pain.
We've got price rejecting a double top, that turned into a large...
2
GOOG_March232015.jpg
Google's weekly & daily charts appear ready to rollover.
Note the touch of the downtrend line, following pop po...
3
AAPL_March202015.jpg
Got to love the last minute of cash trading some days.
Look at AAPL sell off HARD into close, then WHAM right back up
EURUSD_ThreeSplitScreen_March132015.jpg
I received a reminder on how simplicity helps, not hurts traders (and people in general) recently.
So taking it...
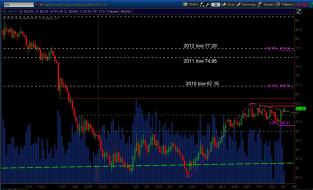
CrudeFuts_Monthly_March122015.jpg
Update on where /cl stands.
Price violated on a pit close the 61.8% level of the range since the low of 2015 ba...
2