Users: Nf6: All Pages
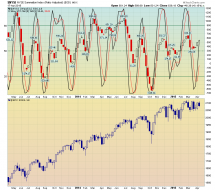
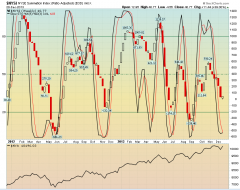
$NYSI
Breadth is oversold

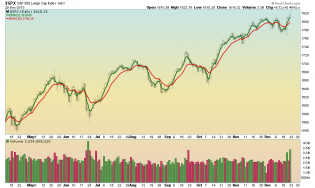
$SPX
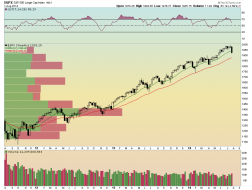
SPX weekly is flirting with the 34 EMA
1
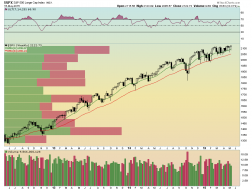
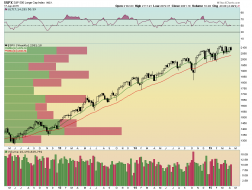
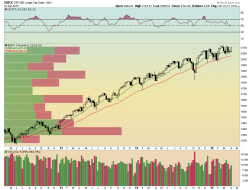
$SPX
Look! Below the 34 week EMA. For how long?
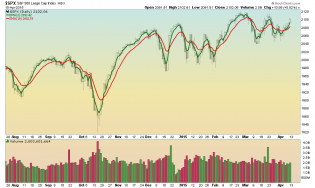
$NYSI
Oversold so maybe a bounce before getting lower
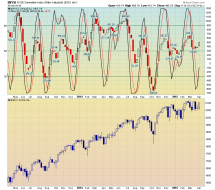
$SPX
We haven't reached the March/April low of around 2040 yet but it is a start. Will we make it in one thrust down or...
$SPX
Nothing to see here folks, move along
$NYSI
Buy signal coming
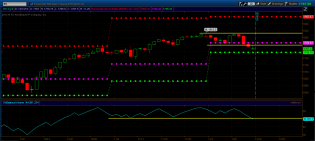
$SPX
Need to get below 2068-2072 to get out of the small range (get below 1972 and the Bears can start talking)
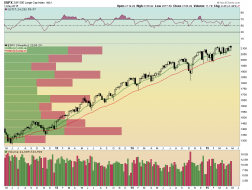
$SPX
$SPX weekly - a succession of higher lows.
1
$NYSI
$SPX weekly - flirting with a buy signal. Wait for it.
1
$SPX
$SPX daily. The market didn't violate it's previous low. This looks more bullish in late June than it did in late May.
1
http://content.screencast.com/users/Jim_Nf6/folders/Jing/media/0b1a...
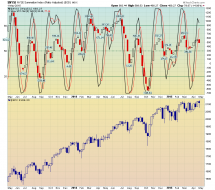
I don't see a fish. I see higher highs and higher lows in a range.
3
http://www.zerohedge.com/sites/default/files/images/user5/imageroot...
2
image
1
$SPX
Short term trend is bullish but we're at the top of the range, doji on the daily, a breakout or stay within the range?
$NYSI
Weekly breadth is on a sell
1
$SPX
Weekly $SPX - persistent bull, hammers on the last two candles = more buying?
$SPX
Relentless
$NYSI
Sell signal coming?
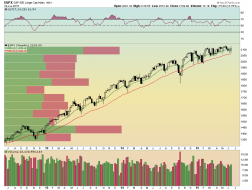
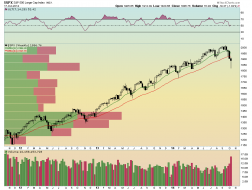
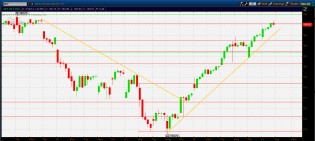
$SPX
Stuck in the upper half of the 2040 to 2120 range
4
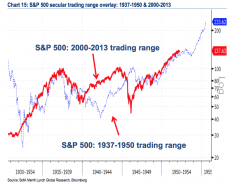
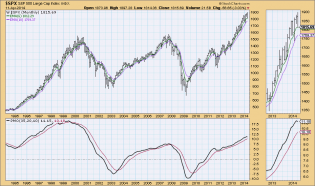
From http://www.ritholtz.com/blog/2015/04/generational-lows-lined-up-overlay-also-suggests-risk-of-cyclical-top-in-2015/
1
3
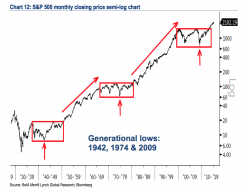
From http://www.ritholtz.com/blog/2015/04/generational-lows-lined-up-overlay-also-suggests-risk-of-cyclical-top-in-2015/
2
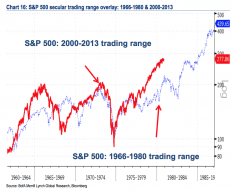
From http://www.ritholtz.com/blog/2015/04/generational-lows-lined-up-overlay-also-suggests-risk-of-cyclical-top-in-2015/
1
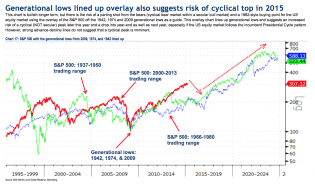
From http://www.ritholtz.com/blog/2015/04/generational-lows-lined-up-overlay-also-suggests-risk-of-cyclical-top-in-2015/

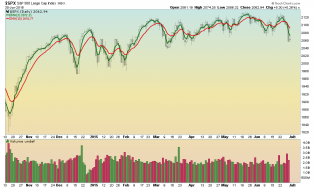
$SPX
SPX daily - Kapow
$NYSI
SPX weekly - NYSE Summation Index - still on a buy signal
$SPX
SPX weekly = bullish trend intact, but note the lower weekly highs and higher weekly lows of late
$SPX
SPX daily - short term trend is bullish
1
$NYSI
NYSE Summation Index weekly - buy signal
1
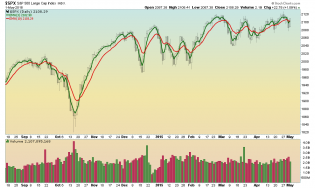
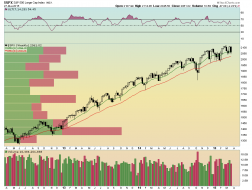
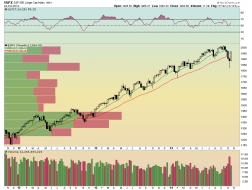
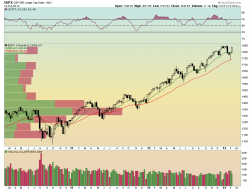
$SPX
SPX weekly - long term trend is bullish
4
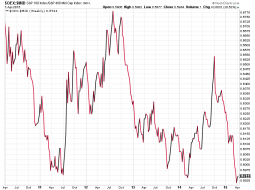
$OEX:$MID
Relative performance of the SP100 to the SP Midcap 400
1
$SPX
SPX daily with 3 and 10 EMAs - short term sell signal
1
$NYSI
NYSI - Summation Index weekly - getting oversold
$SPX
SPX weekly with 13 and 34 EMAs - still long term bullish. This isn't very sensitive to short term swings, see for...
1
http://content.screencast.com/users/Jim_Nf6/folders/Jing/media/721b...
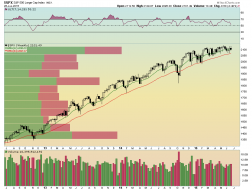
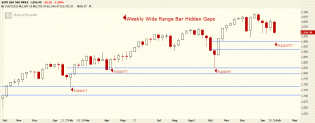
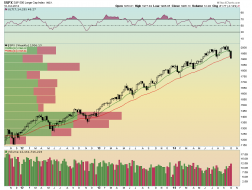
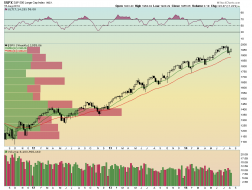
$SPX weekly wide range bars with hidden gaps act as support
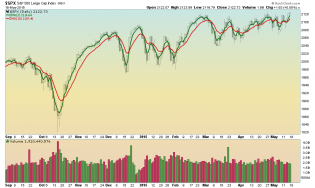
$SPX
SPX Daily - buy buy buy
$NYSI
NYSI weekly - initial buy signal. It could form a complex bottom, but we shall soon see.
$SPX
SPX weekly - and the bull is back
http://content.screencast.com/users/Jim_Nf6/folders/Jing/media/ca23...
Getting close to shorting
2
$SPX
Last two days have yet to recover to the 10 EMA
1
$NYSI
No buy signal yet
$SPX
2nd week below both EMAs - just look at that weekly candle! Bounce coming?
3
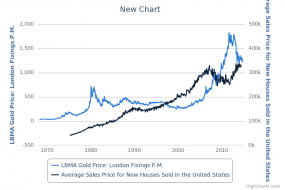
New Chart
Gold vs. Avg Home Price
3
$SPX
SPX daily with 3 and 10 EMAs - knock, knock, knockin' on the August lows. I see lower highs.
$NYSI
Still on the sell signal
1
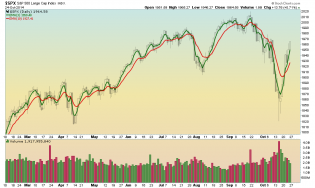
$SPX
SPPX weekly with 13 and 34 EMAs. Starting to get beary beary scary.
2
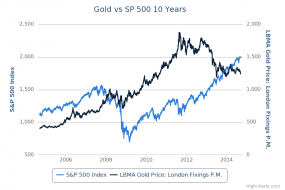
Gold vs SP 500 10 Years
As requested
4
http://content.screencast.com/users/Jim_Nf6/folders/Jing/media/b97e...
Silver has a date with <$18
$SPX
SPX daily - 3,10 EMA crossover, bear sniffing?
$NYSI
SPX weekly with summation index - no short signal yet
$SPX
Weekly SPX - the bull is unrelenting.
1
http://content.screencast.com/users/Jim_Nf6/folders/Jing/media/28d9...
Silver has a date with the previous lows
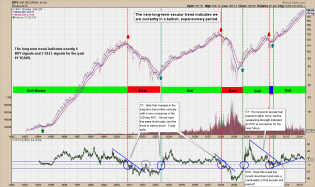
Click to View
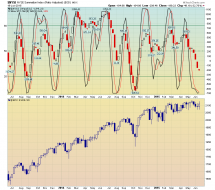
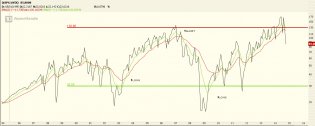
While the indicator resembles a moving average, the S&P projected price tracks the S&P 500 average of monthly clos...
4
Click to View
1
http://content.screencast.com/users/Jim_Nf6/folders/Jing/media/ac5e...
Silver headed to 19.30 or lower
$SPX
SPX daily - bullish
All three time frames indicate long
$NYSI
NYSE Summation Index - stochastic crossover - buy signal is imminent.
1
$SPX
SPX weekly - long term bullish - unchanged
Presidential Cycle Pattern 2nd term presidents
The second year of a second term president can be difficult
http://pragcap.com/2nd-presidential-years-are-different
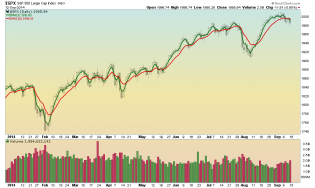
$SPX
Short term trend is still bearish despite Friday's pop. I'm watching the April 4 high of 1897 and the May 13 high...
1
$NYSI
Wow, both stochastics are at 0. Once we have the crossover, we'll have a good signal to get long since this aligns...

$SPX
SPX weekly - still bullish since we aren't close to a MA crossover. We had a little "doji" week and it remains to...
2
$SPX
Long term trend remains intact (up, of course).
$NYSI
Intermediate term trends (breadth) is down, signal from 4 weeks ago was a good one.
1
$SPX
Short term trend is down (duh)
http://content.screencast.com/users/Jim_Nf6/folders/Jing/media/54b1...
Ready for the bounce?
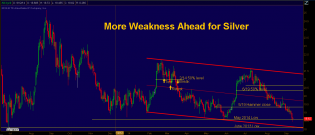
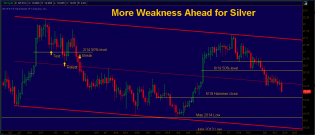
http://content.screencast.com/users/Jim_Nf6/folders/Jing/media/2239...
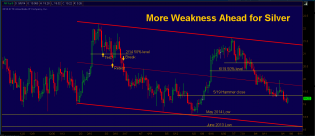
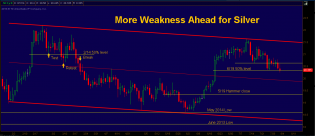
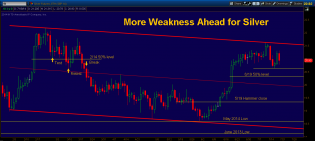
More weakness ahead for silver
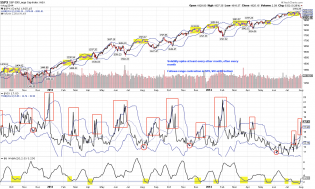
The Fat Pitch: Weekly Market Summary
From the Fat Pitch:
http://fat-pitch.blogspot.ca/2014/08/weekly-market-summary.html#more
A second part of th...
1
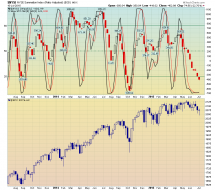
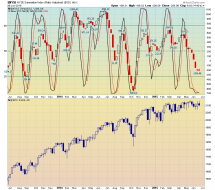
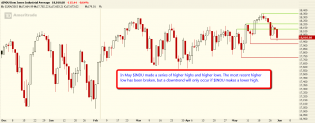
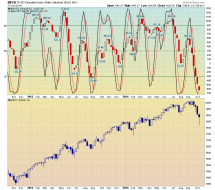
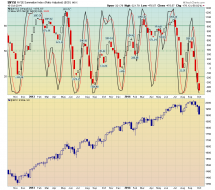
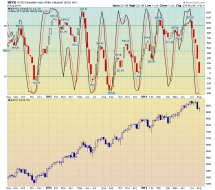
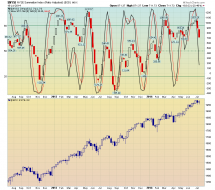
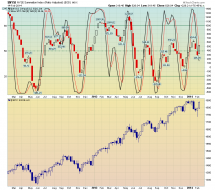
http://content.screencast.com/users/Jim_Nf6/folders/Jing/media/17af...
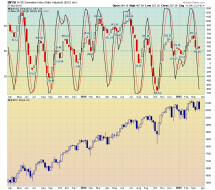
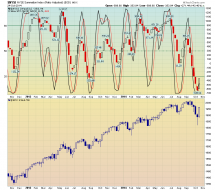
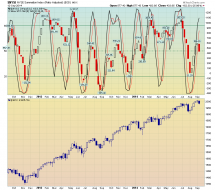
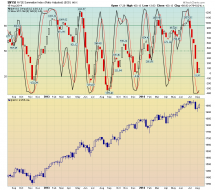
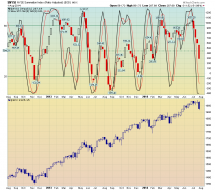
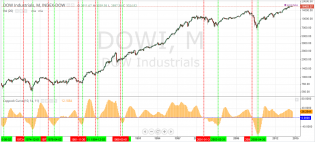
Dow Industrials, monthly with Coppock Curve
http://content.screencast.com/users/Jim_Nf6/folders/Jing/media/faf9...
Thoughts on Silver
More weakness ahead; I'm looking for a test of of the recent 50% level of the large body 6/1...
The Fat Pitch: Weekly Market Summary
http://fat-pitch.blogspot.ca/2014/07/weekly-market-summary_18.html
Breadth has not been strong over the past se...
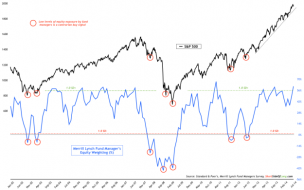
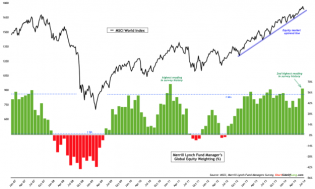
Merrill Lynch Fund Managers Global Equity Weighting
http://shortsideoflong.com/2014/07/fund-managers/
Chart 2: Managers hold the 2nd highest exposure to equities i...
Merrill Lynch Fund Managers Global Equity Weighting
http://shortsideoflong.com/2014/07/fund-managers/
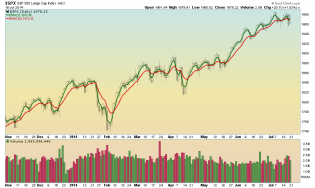
$SPX
$SPX weekly with 13 and 34 EMAs (7/18/14)
Nothing bearish here
1
$NYSI
$NYSI weekly (7/18/14)
Breadth has broken but this could signal consolidation instead of a down turn.
$SPX
$SPX daily with 3 and 10 EMAs (7/18/14)
Short term trend reversed in twice in two days. Let's see what happens...
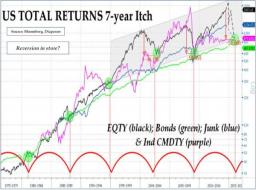
The Stock Market's Seven-Year Itch | Zero Hedge
If past is indeed sometimes prologue, this simple chart might be hinting that a rally similar in arithmetical rang...

Mission Accomplished | Zero Hedge
1
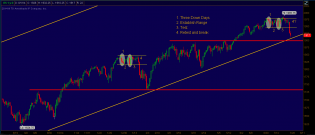
Intermarket Analysis & Business Cycle Investing - David Calloway...
SPY Daily, ROC(250) is breaking the trend but is not negative.
from David Calloway
3
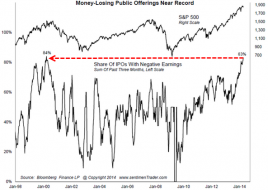
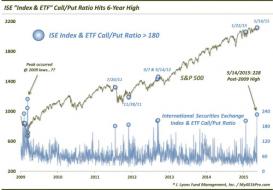
Peak "Greatest Fool" | Zero Hedge
From Sentimentrader.com
2

Intermarket Analysis & Business Cycle Investing - David Calloway...
avid Calloway chart.
Break in trend on the ROC(250) -early warning, it's not negative yet and the 100 EMA is no...
2
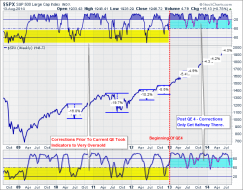
DecisionPoint Market Analysis Chart Gallery - StockCharts.com -...
From Carl Swenlin at Decision Point
3
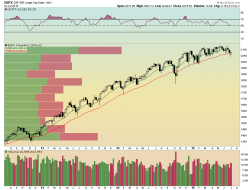
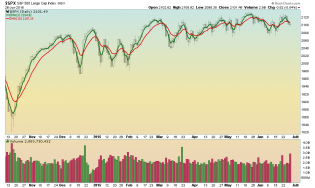
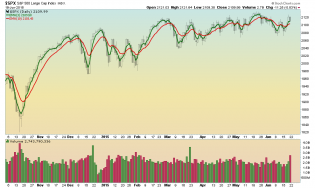
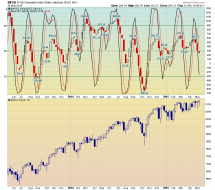
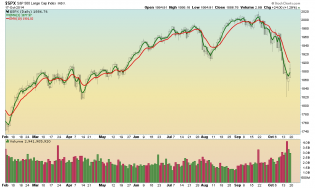
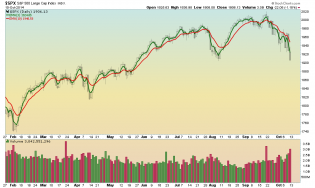
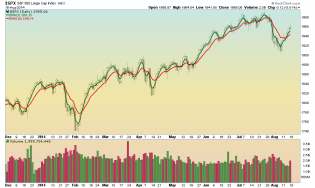
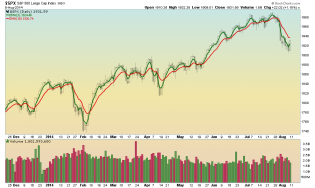
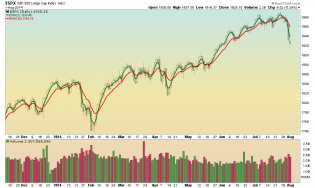
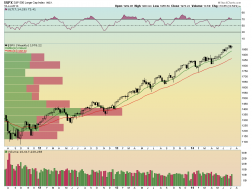
$SPX
SPX weekly
Gotta get down to the 34 week EMA
3
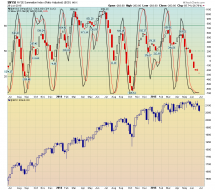
$NYSI
NYSE Summation Index weekly
More work to the downside to be done.
4
dshort Featured Charts
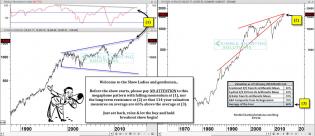
Chris Kimble
dshort Featured Charts
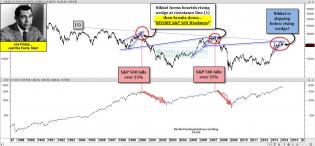
Nikkei and SP500
2
dshort Featured Charts
Weekly Bearish Harami in Major Indices
2
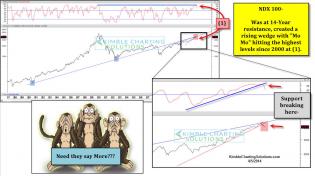
dshort Featured Charts
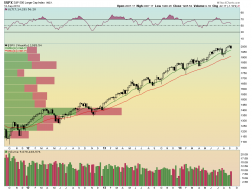
Long Term Resistance
1
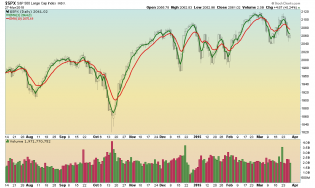
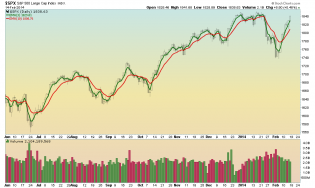
$SPX
SPX weekly with 13 and 34 EMAs (2/14/14)
Bounce of the 34 EMA
$NYSI
NYSE Summation Index weekly (2/14/14)
Despite the rise of the last two weeks, the stochastic indicator on bread...
1
$SPX
SPX daily with 3 and 10 EMAs (2/14/14)
http://content.screencast.com/users/Jim_Nf6/folders/Jing/media/28c9...
SPY 78 minute bars (5 bars per day)
Support and resistance lines are drawn based on the first day of the month...
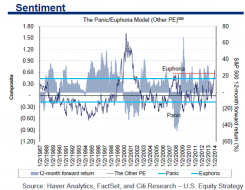
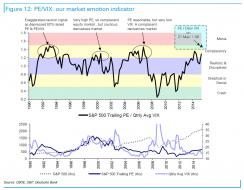
2-Sentiment Panic/Euphoria Model
Citi Panic Euphoria Model
$NYSI
NYSE Summation Index 1/17/14
Short term overbought but we need to wait for alignment with the short term to consider...
1
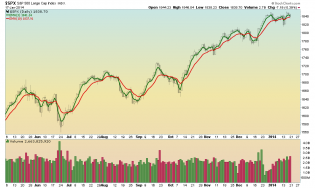
$SPX
SPX daily with 3 and 10 EMAs (1/17/14)
A new high - short term bull.
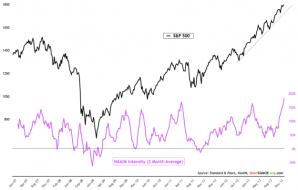
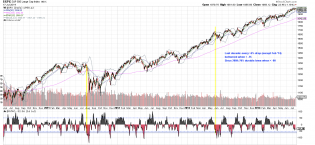
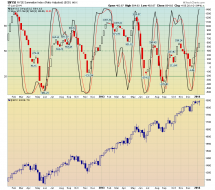
NAAIM Intensity
From the Short Side of Long
Over the last several weeks, the most bullish managers have been fully invested and...
http://content.screencast.com/users/Jim_Nf6/folders/Jing/media/6d1e...
NYSE Summation Index weekly with slow stochastic (5,3) (12/20/13)
Buy signal is imminent.
1
$SPX
SPX daily with 3 and 10 EMAs (12/20/13)
Yesterday's higher high has reestablished the short term uptrend.
1
http://content.screencast.com/users/Jim_Nf6/folders/Jing/media/b15c...
/ES daily with monthly Person's Pivots and On Balance Volume
Breakdown in OBV